Insights into 2013 production and destruction
Alternate title: EVE Online Graph porn of 2013.
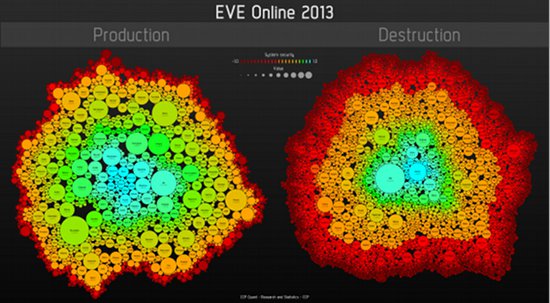
Last year, for the presentation on the EVE Economy at Fanfest, I made a graph titled "EVE Online 2012: Production vs. Destruction" (400dpi version). A Redditor named SurteaD sent me a message about a month ago asking if the players might see a 2013 version of that graph. I personally was interested in seeing it myself and since it's procedurally generated with d3.js from a database query, I figured it wouldn't take me long to "refresh" them. So, without further ado, I present to you EVE Online 2013: Production vs. Destruction:

(click image for a larger version)
For those few of you reading this that don't know much about EVE Online, here is a short description at what you are looking at:
In the EVE Online universe, war is an ongoing machine that is fueled by production. Most wars take place in the outermost regions of space (red on the scale), far beyond the safety of the high security regions of the Empires (light blue on the scale). The most favorable conditions for production are a mix of close proximity to major market hubs and the safety provided by the high security regions surrounding them. This visualization tells this story, showing the total produced- and destroyed-value of end products (ships and modules), where production mainly takes place in higher-security space (yellow to blue) and the majority of destruction takes place in low- or null-security space (orange to red).
A few important things I'd like to note:
- The bubble sizes are relative to each group but not both, i.e. The size of a bubble on the destruction side is not relative to the size of a bubble on the production side. This is because, production is much higher so the bubbles would be much smaller on the destruction side
- The numbers in the bubbles have been scaled down by 1e9 or 1 Billion.
- Destruction values is the lost value of all kill-mails in 2013, i.e. it includes not only what was destroyed but also what dropped. On top of that, since supercapitals don't have a market-price, their production cost was added to the killmail value.
- Production values are end products, not components.
- System names are truncated in some cases to fit into the respective bubble. To see the exact system names and values, check out the source code of the destruction graph below (read further)
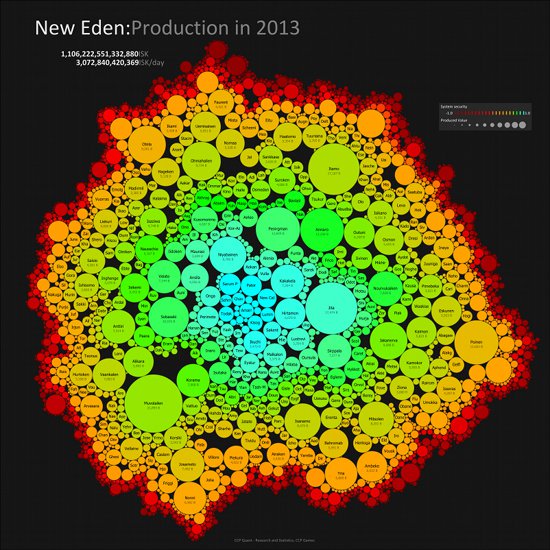
- No system names below 0.5 are shown in the production part :)
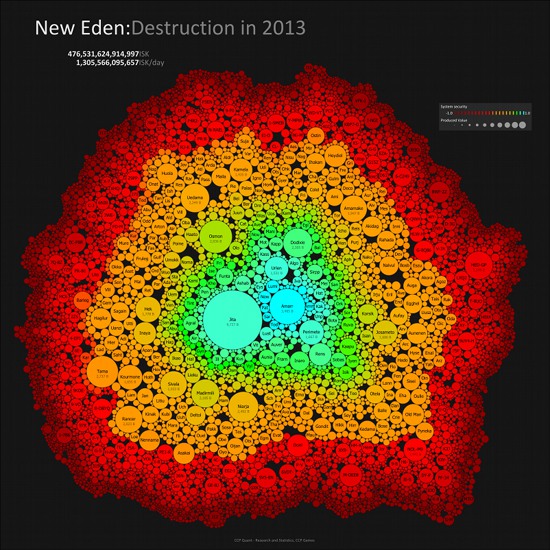
Now I also generated two different graphs for splitting things up and give greater detail:


(click images for a larger version)
Last year, one spacebro, while looking at the 2012 graph, said he sometimes hated to be colorblind (redditor zxnmpowq). I did promise you I'd make the code accessible that generates these graphs, so here it is, courtesy of JSFiddle! Code quality was not a priority but I hope it's somewhat readable for those that want to dig into it. Much like our beloved EVE Online, D3.js has a pretty steep learning curve, so be patient with it :). Feel free to make your own versions of this, fork and make different visualizations of it, just be sure to post your results on forums or reddit if you want our attention! For those that don't know how to program, you can at least enjoy the possibility of hovering over each circle to get a tooltip of the underlying system name, its security status and total destruction value in 2013.
You may use this code for non-commercial purposes only, on the condition that the following copyright notice is displayed prominently on any page where the code appears:
©2014 CCP hf. EVE Online and the EVE logo are the registered trademarks of CCP hf. All rights are reserved worldwide. All other trademarks are the property of their respective owners. EVE Online, the EVE logo, EVE and all associated logos and designs are the intellectual property of CCP hf. All artwork, screenshots, characters, vehicles, storylines, world facts or other recognizable features of the intellectual property relating to these trademarks are likewise the intellectual property of CCP hf.
As well, when using materials or content that was originally published elsewhere, proper credit must be given to the original author and used only by permission.
The underlying data is included there in the source code but unfortunately you have to suffice with only destruction data for now, production data is very sensitive since not all of it is public knowledge. I.e. we don't want to just flat out give everyone a list of top low- and nullsec-production systems for somewhat obvious reasons.
I still remember a few promises made at the econ lecture at Fanfest 2013, regarding releasing datasets to the community for doing your own analysis. I can tell you that it still is our goal to do so. Dates are not confirmed yet but Fanfest 2014 is coming soon and we want you guys to have been able to play with the data before then. So stay tuned for a further blogs on data availablity.
One final honorable mention, is this fancy infograph by Elena Melkan, taking the statistics we released in the form of simple excel graphs and turning it into an eye candy like this! This is a prime example of why it is important for companies like CCP to make data available to their communities!
New to EVE? Start your 14-day free trial today.
Returning pilot? Visit Account Management for the latest offers and promotions.
