Monthly Economic Report - October 2017
This is the Monthly Economic Report (MER) for October 2017.
The raw data and graphs that make up this report, including the killmail data, can be downloaded here (29 MB).
Click on any graph in this report for an enlarged version.
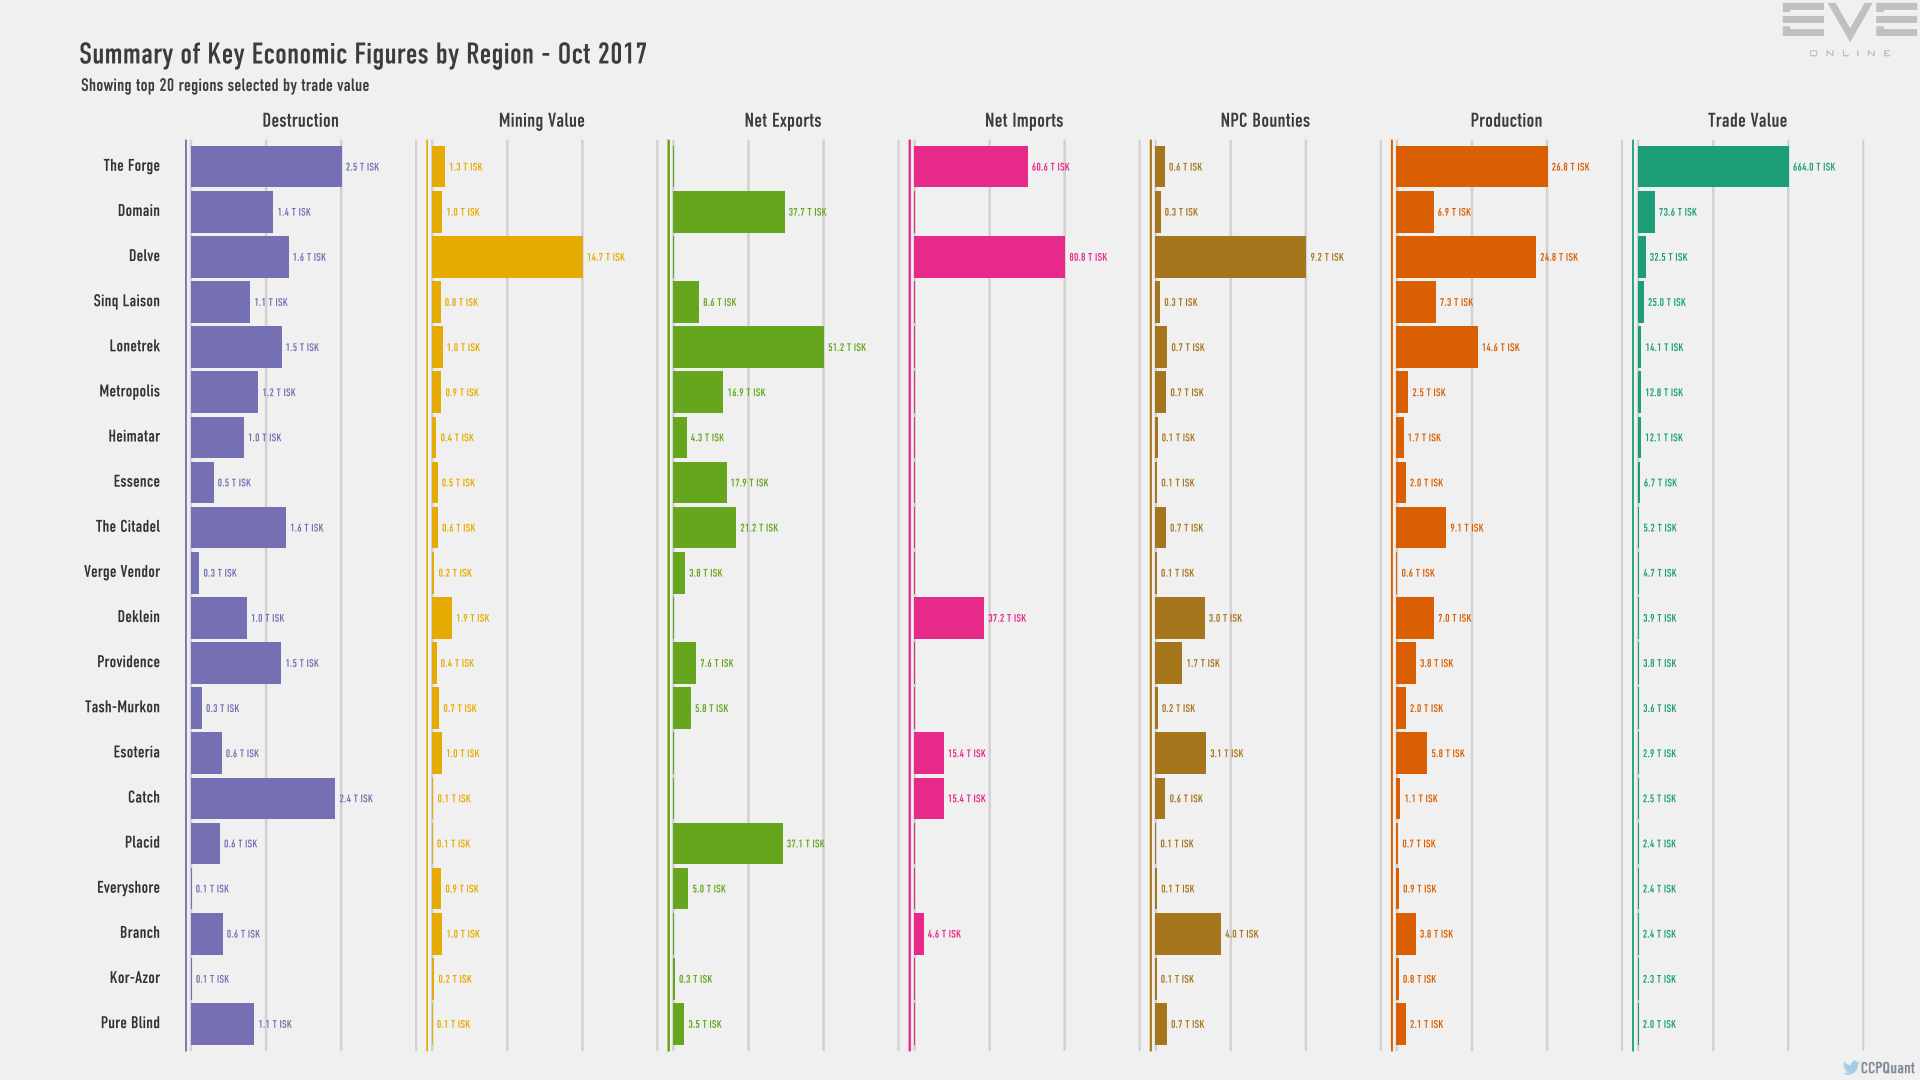
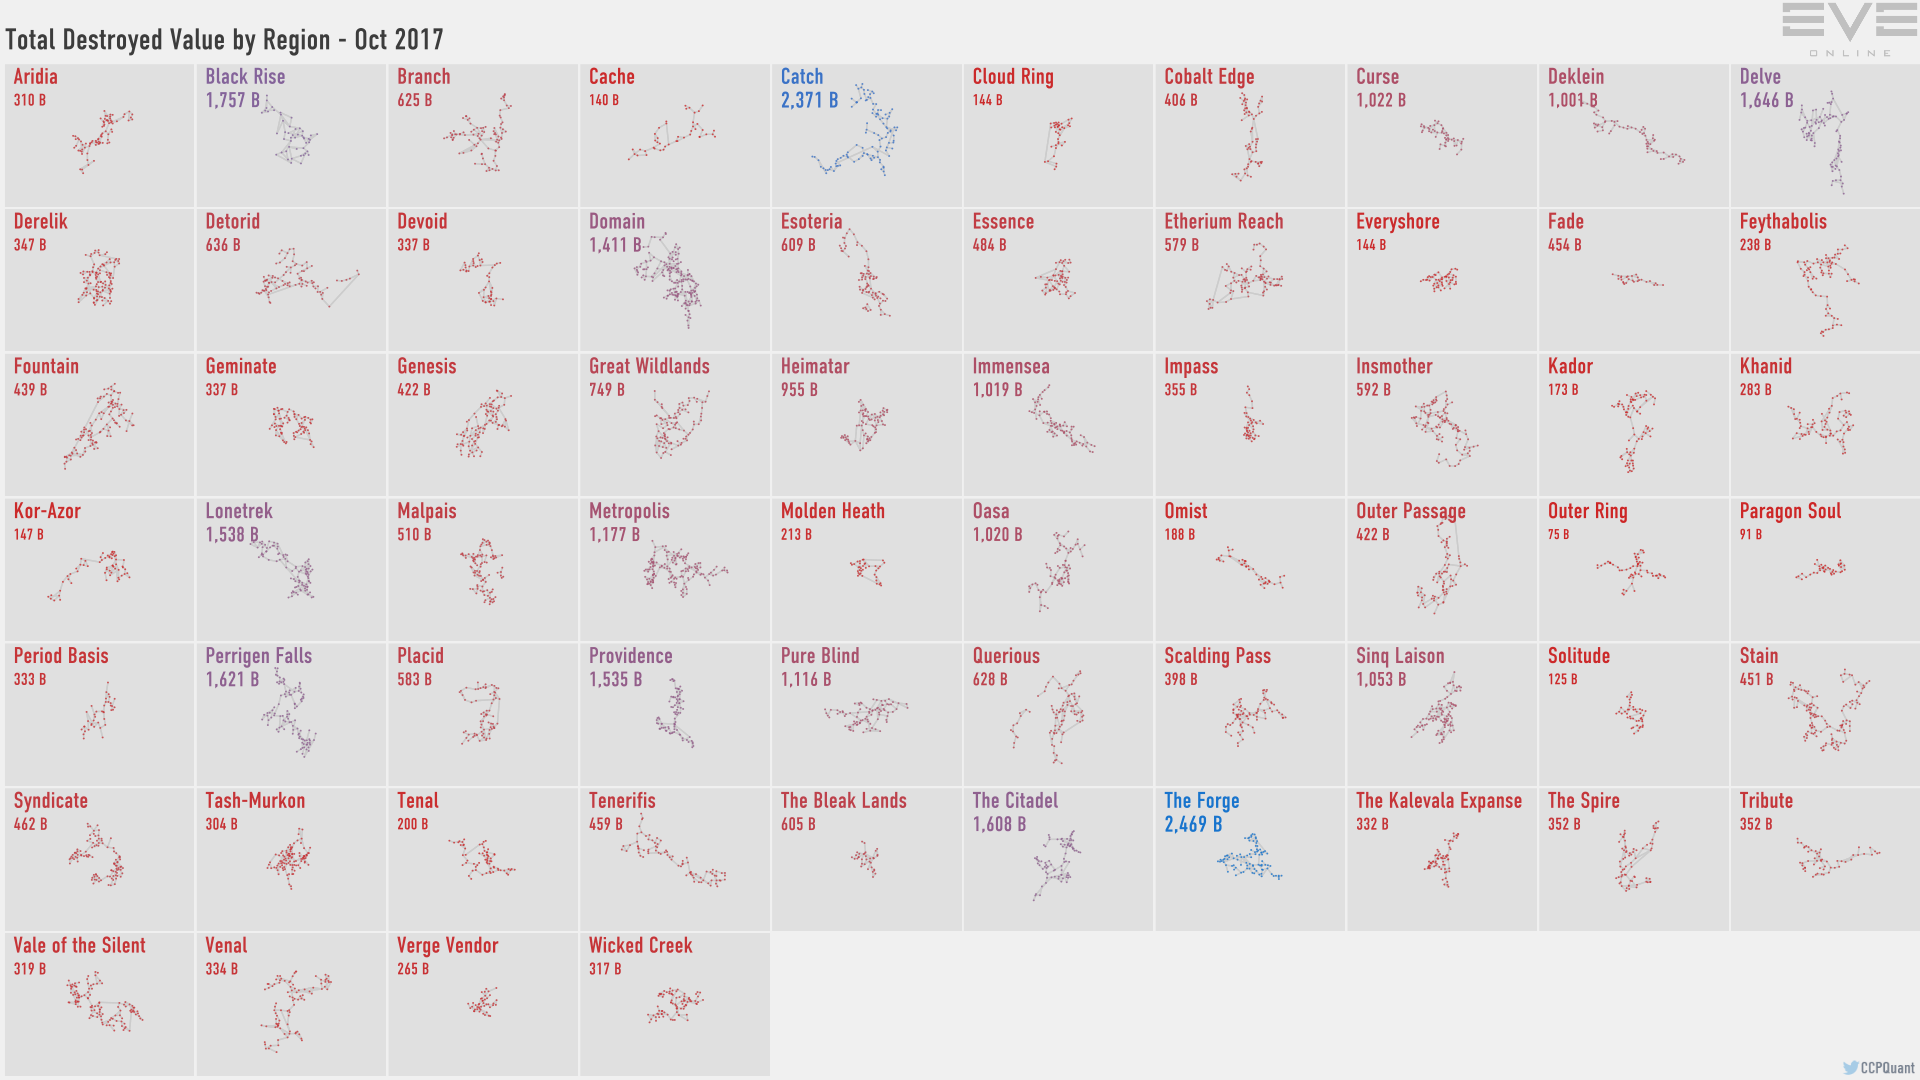
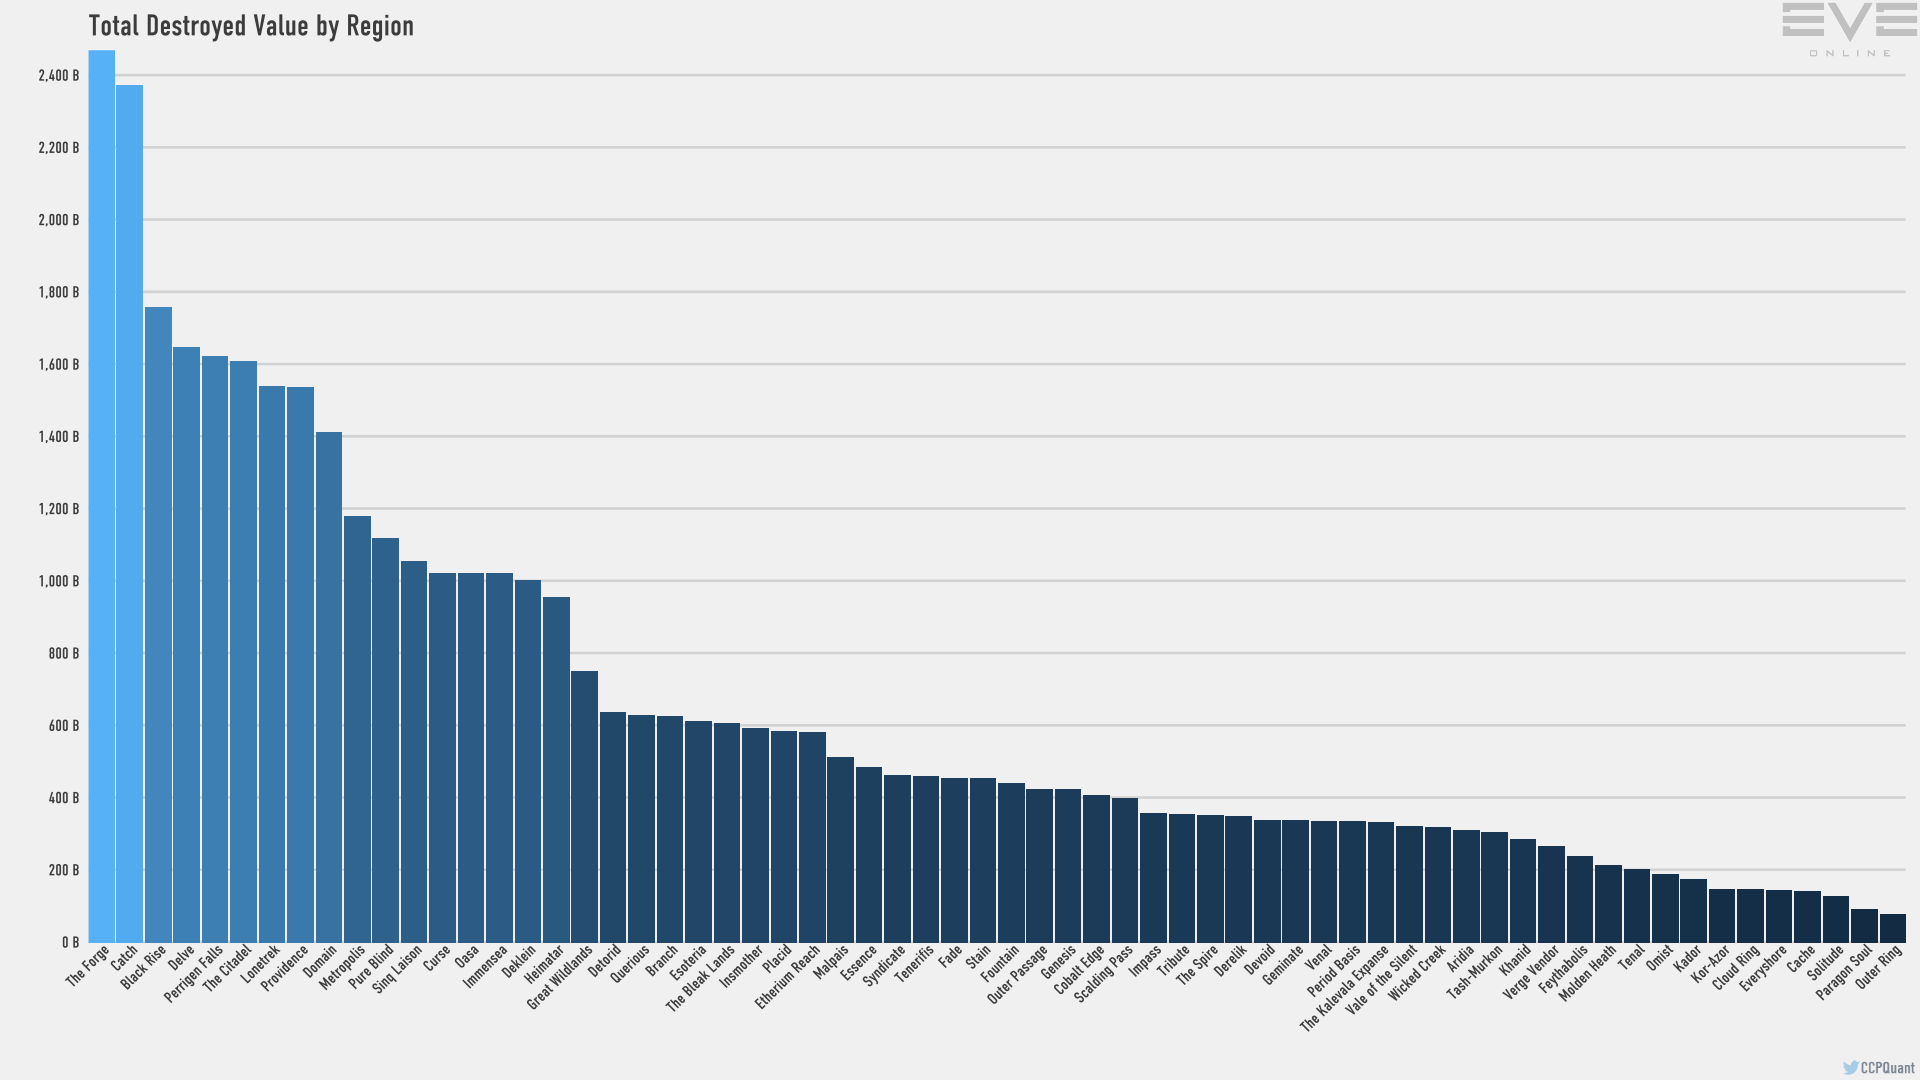
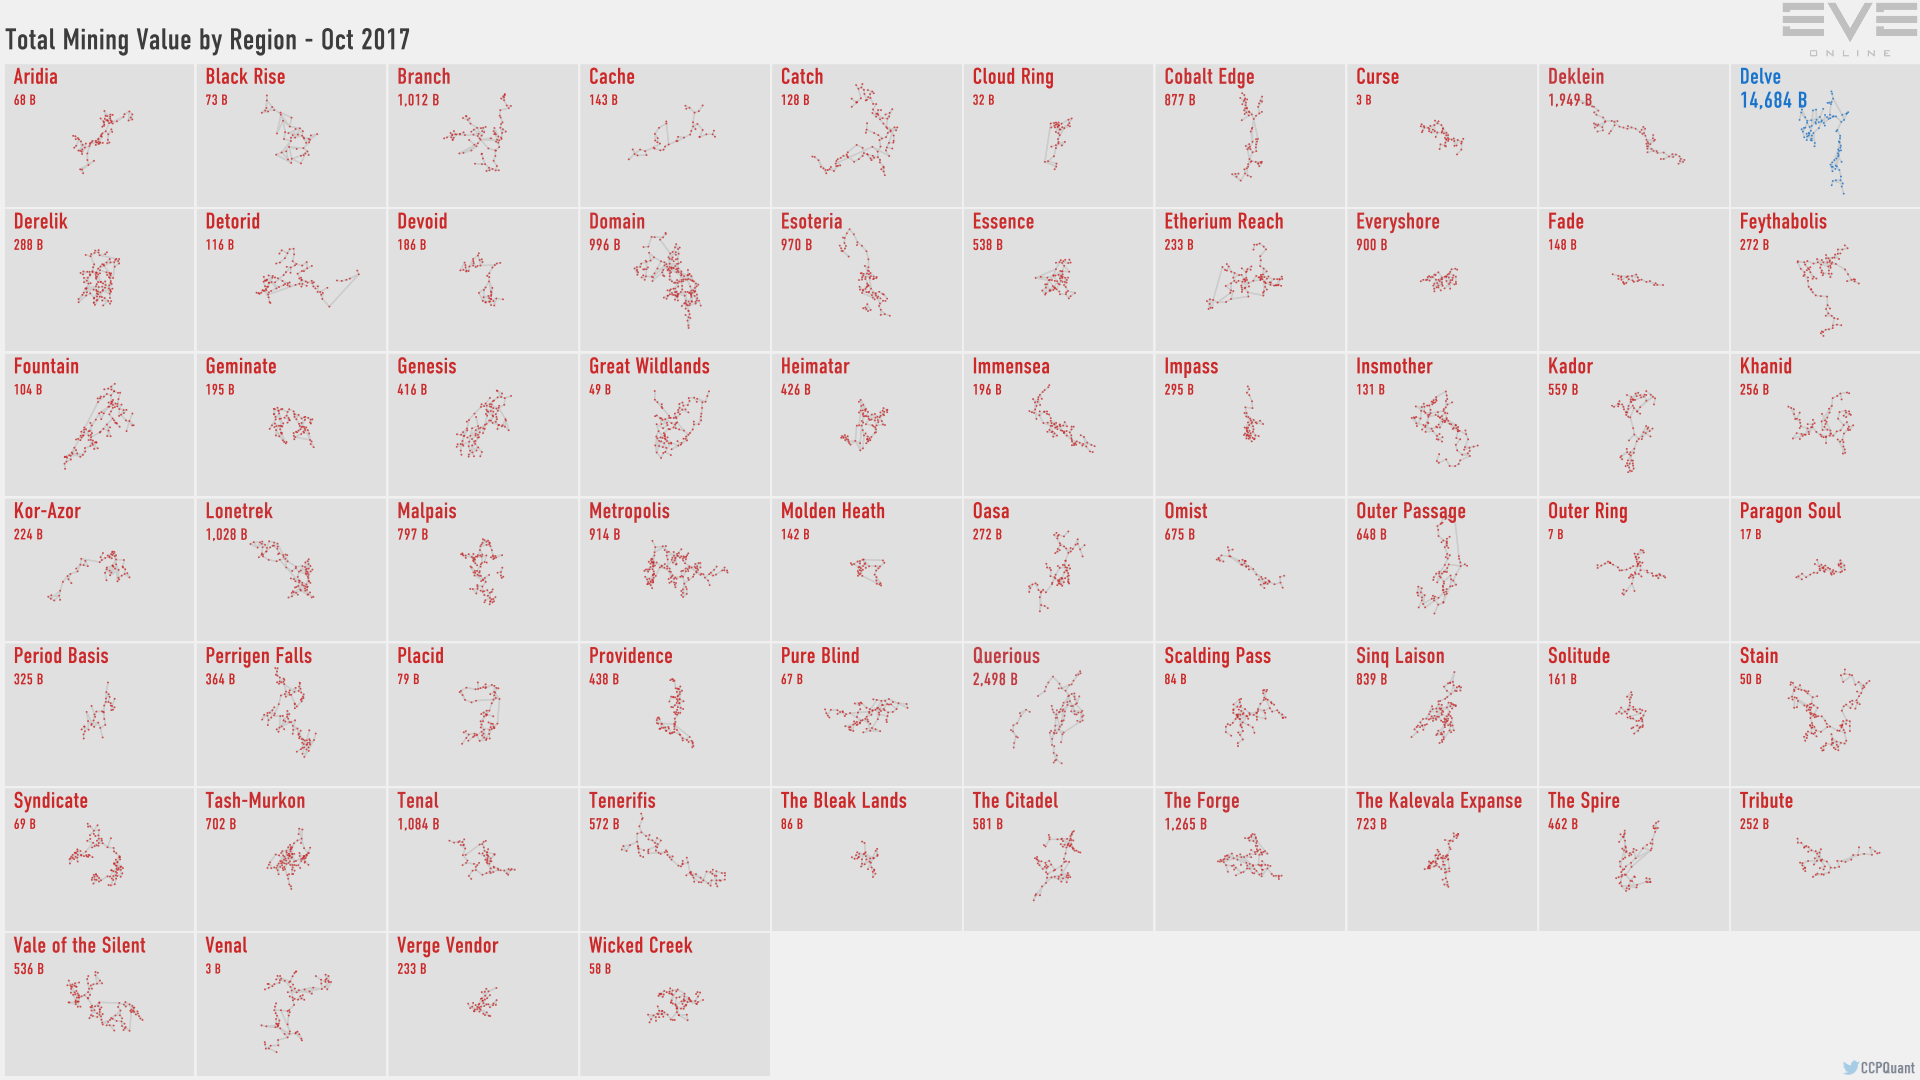
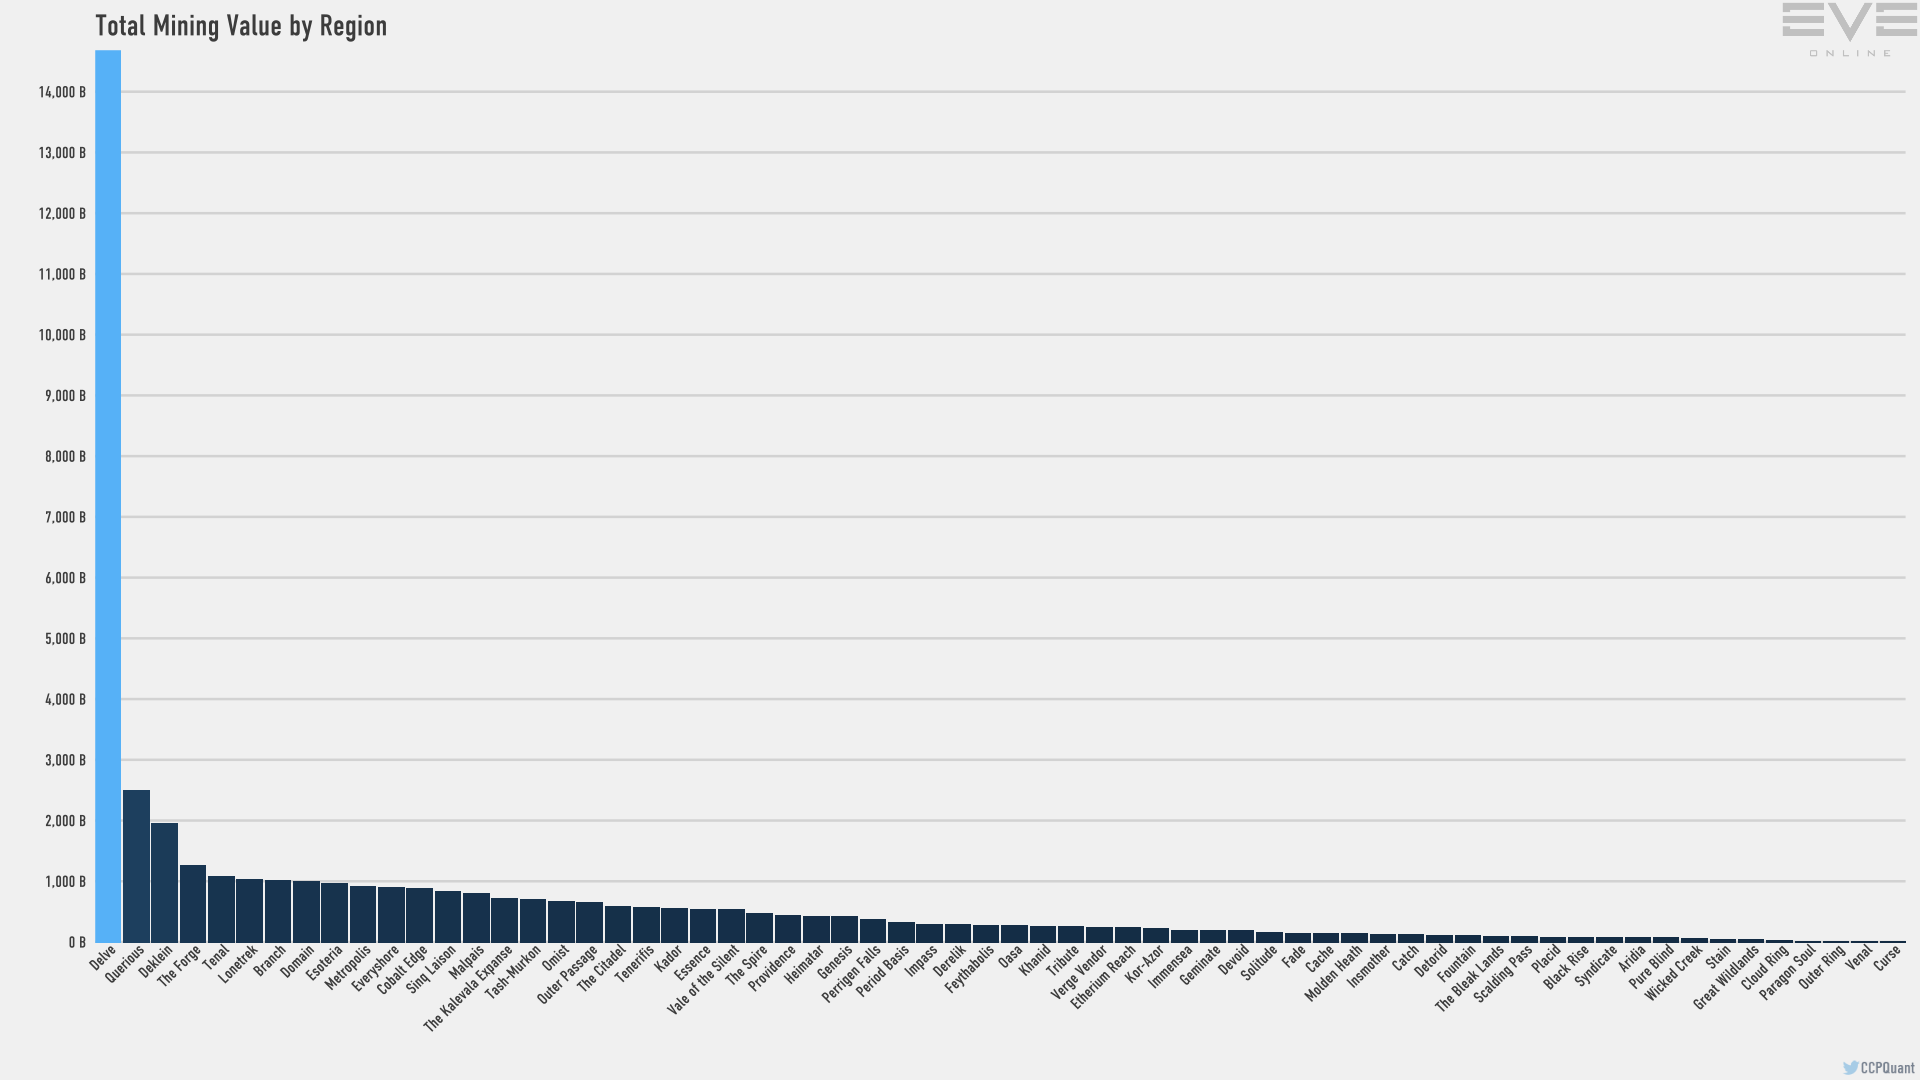
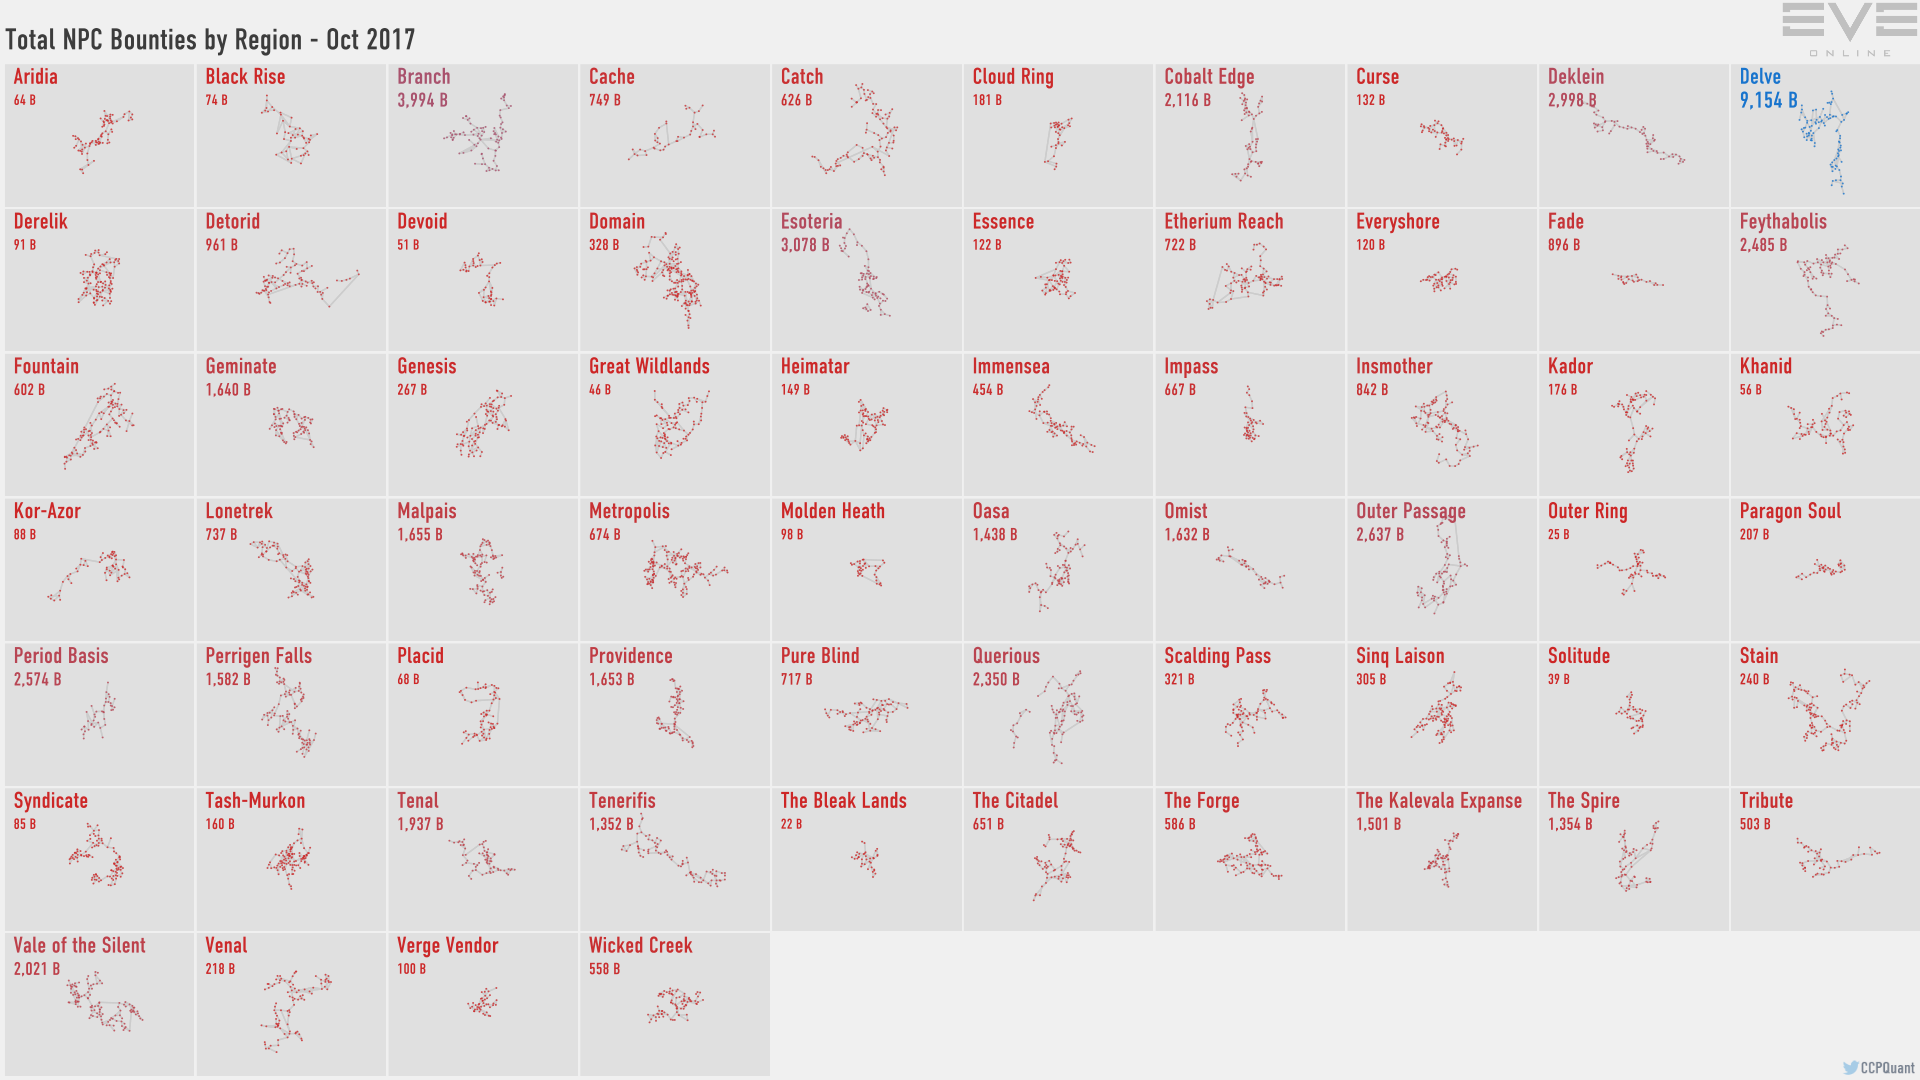
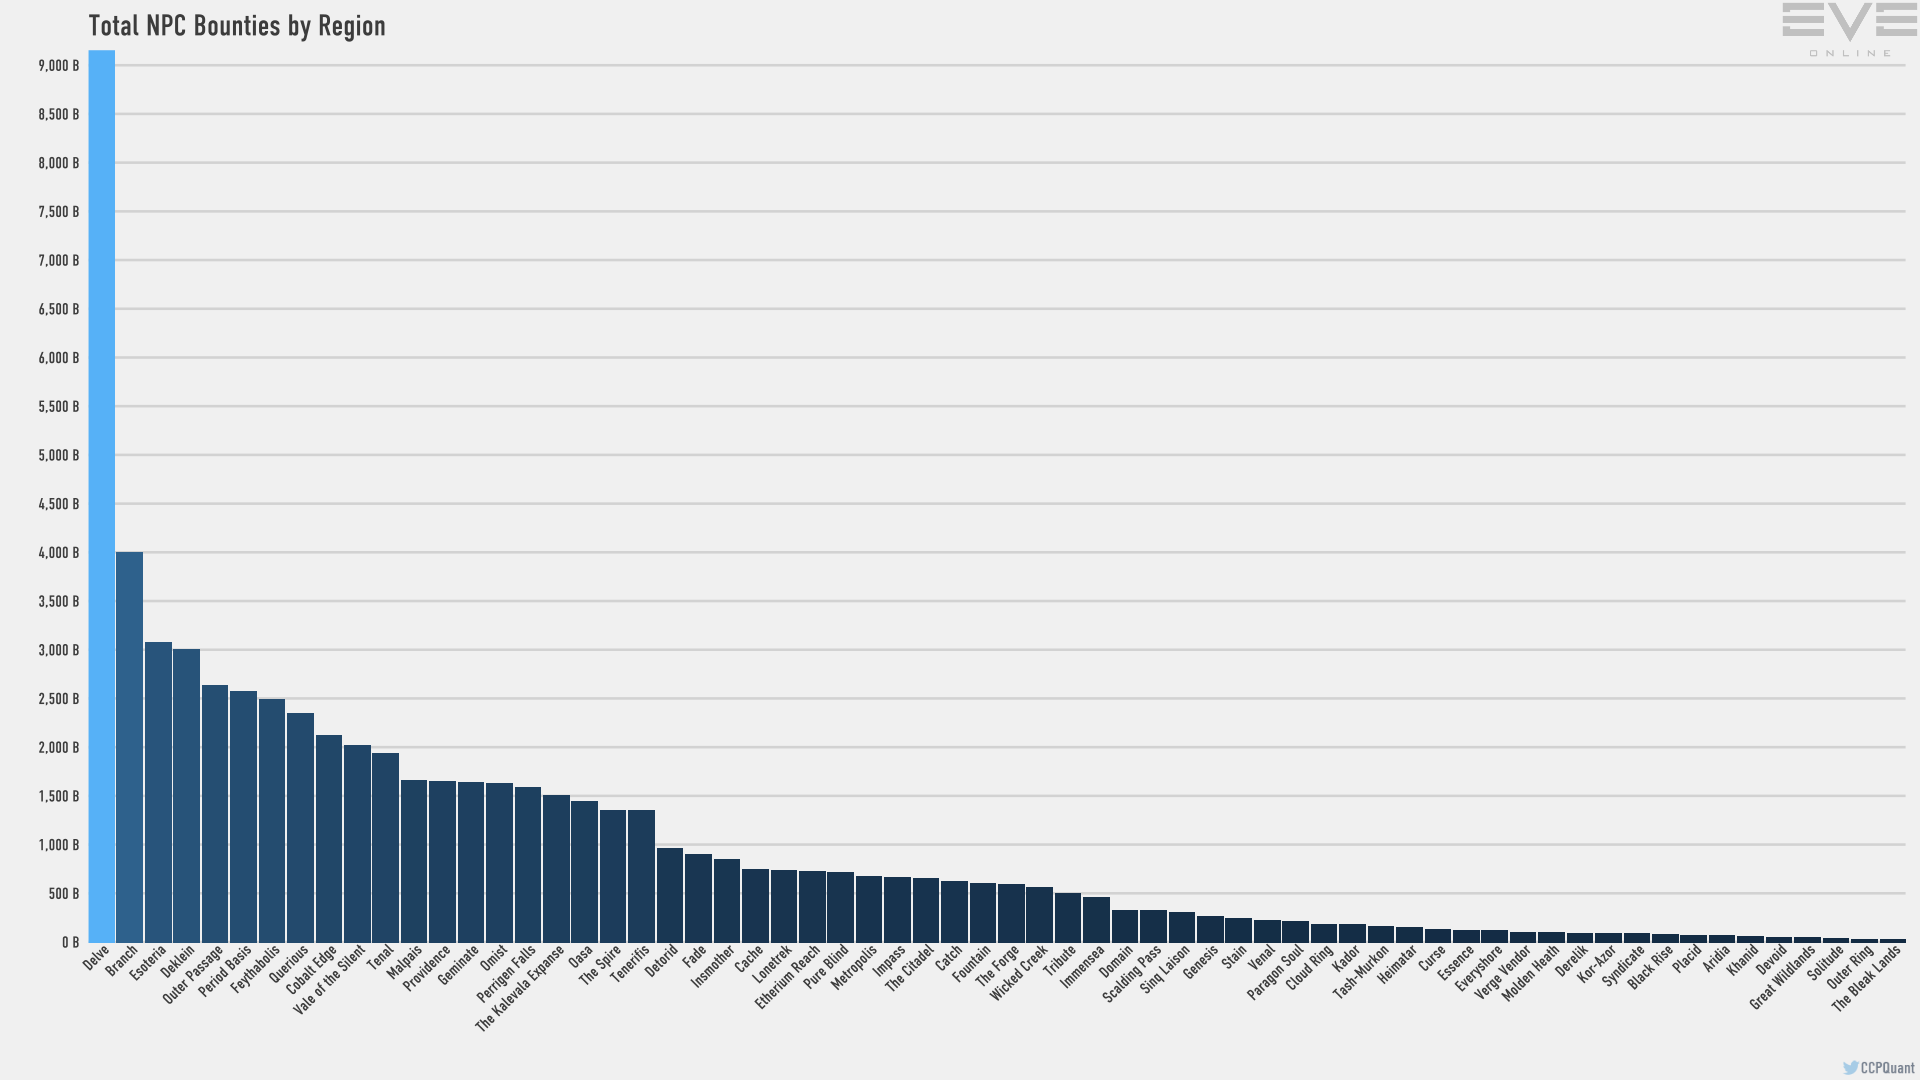
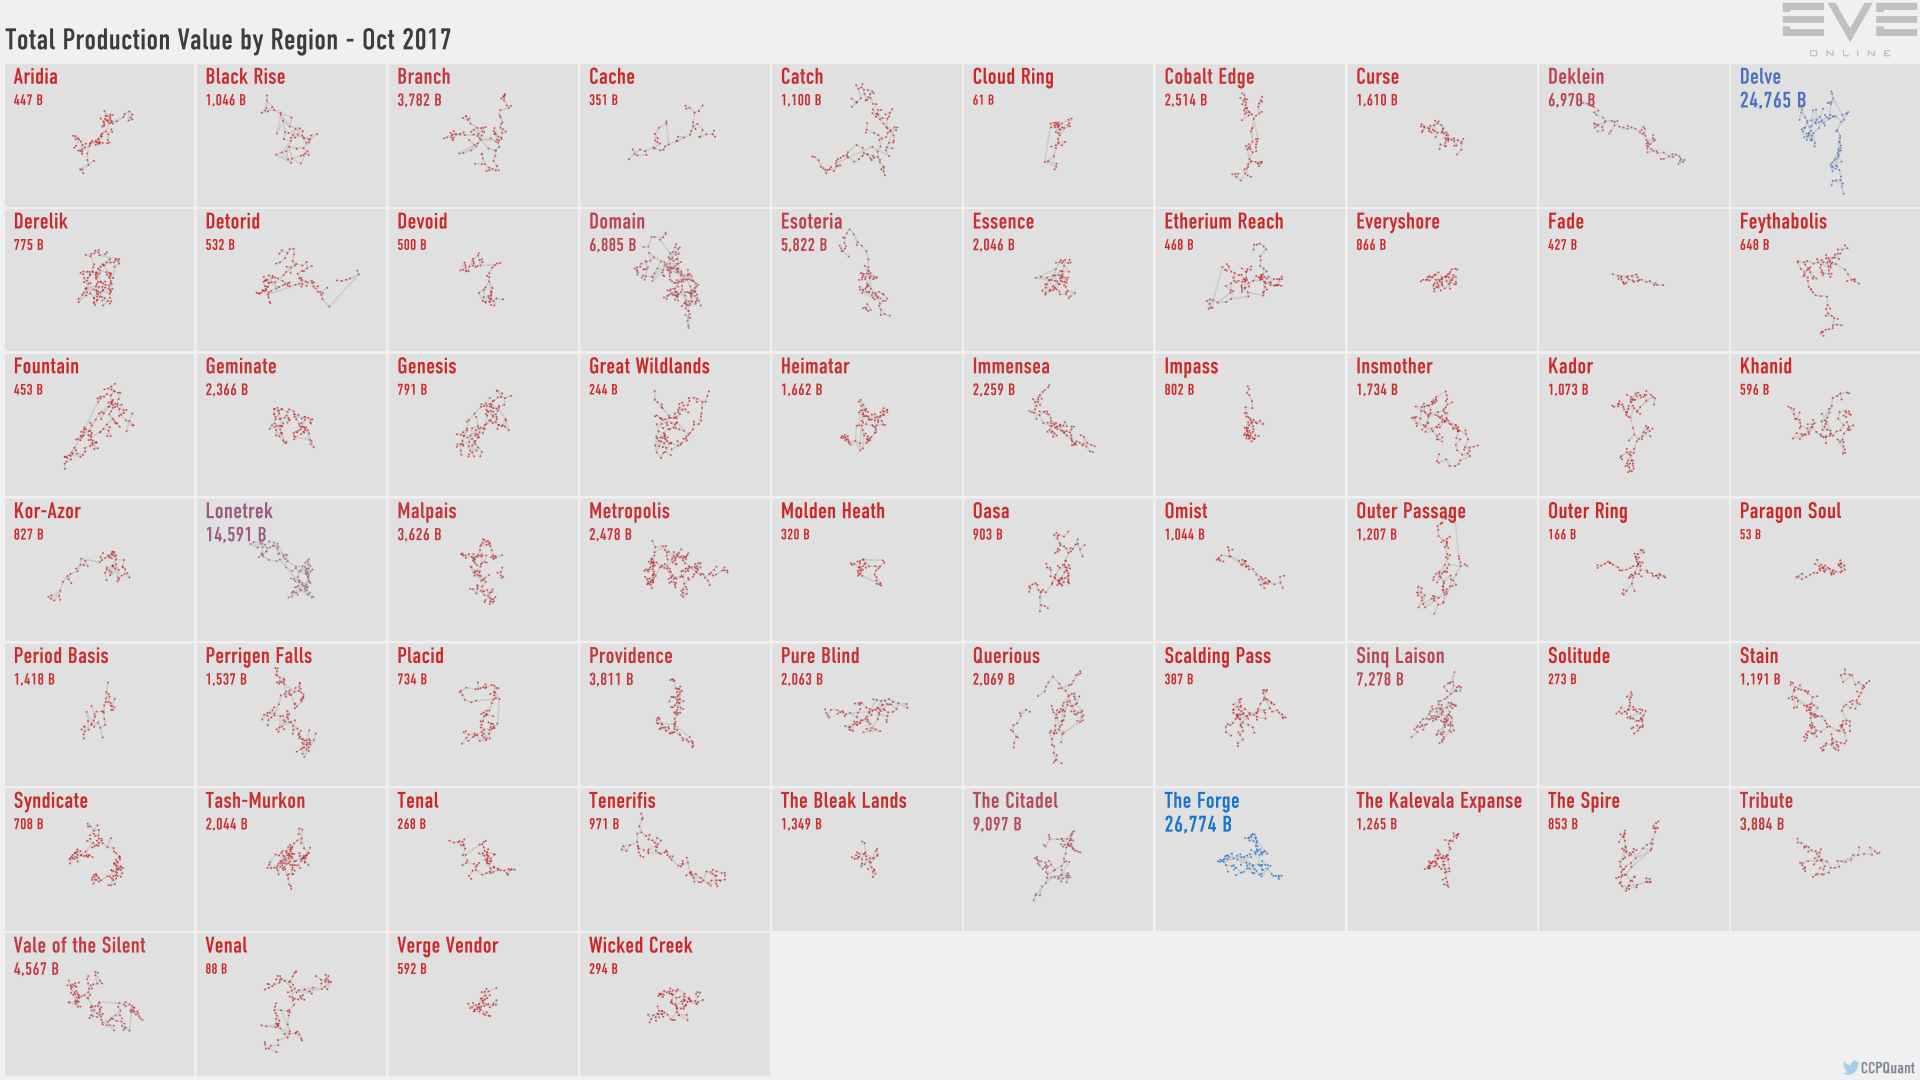
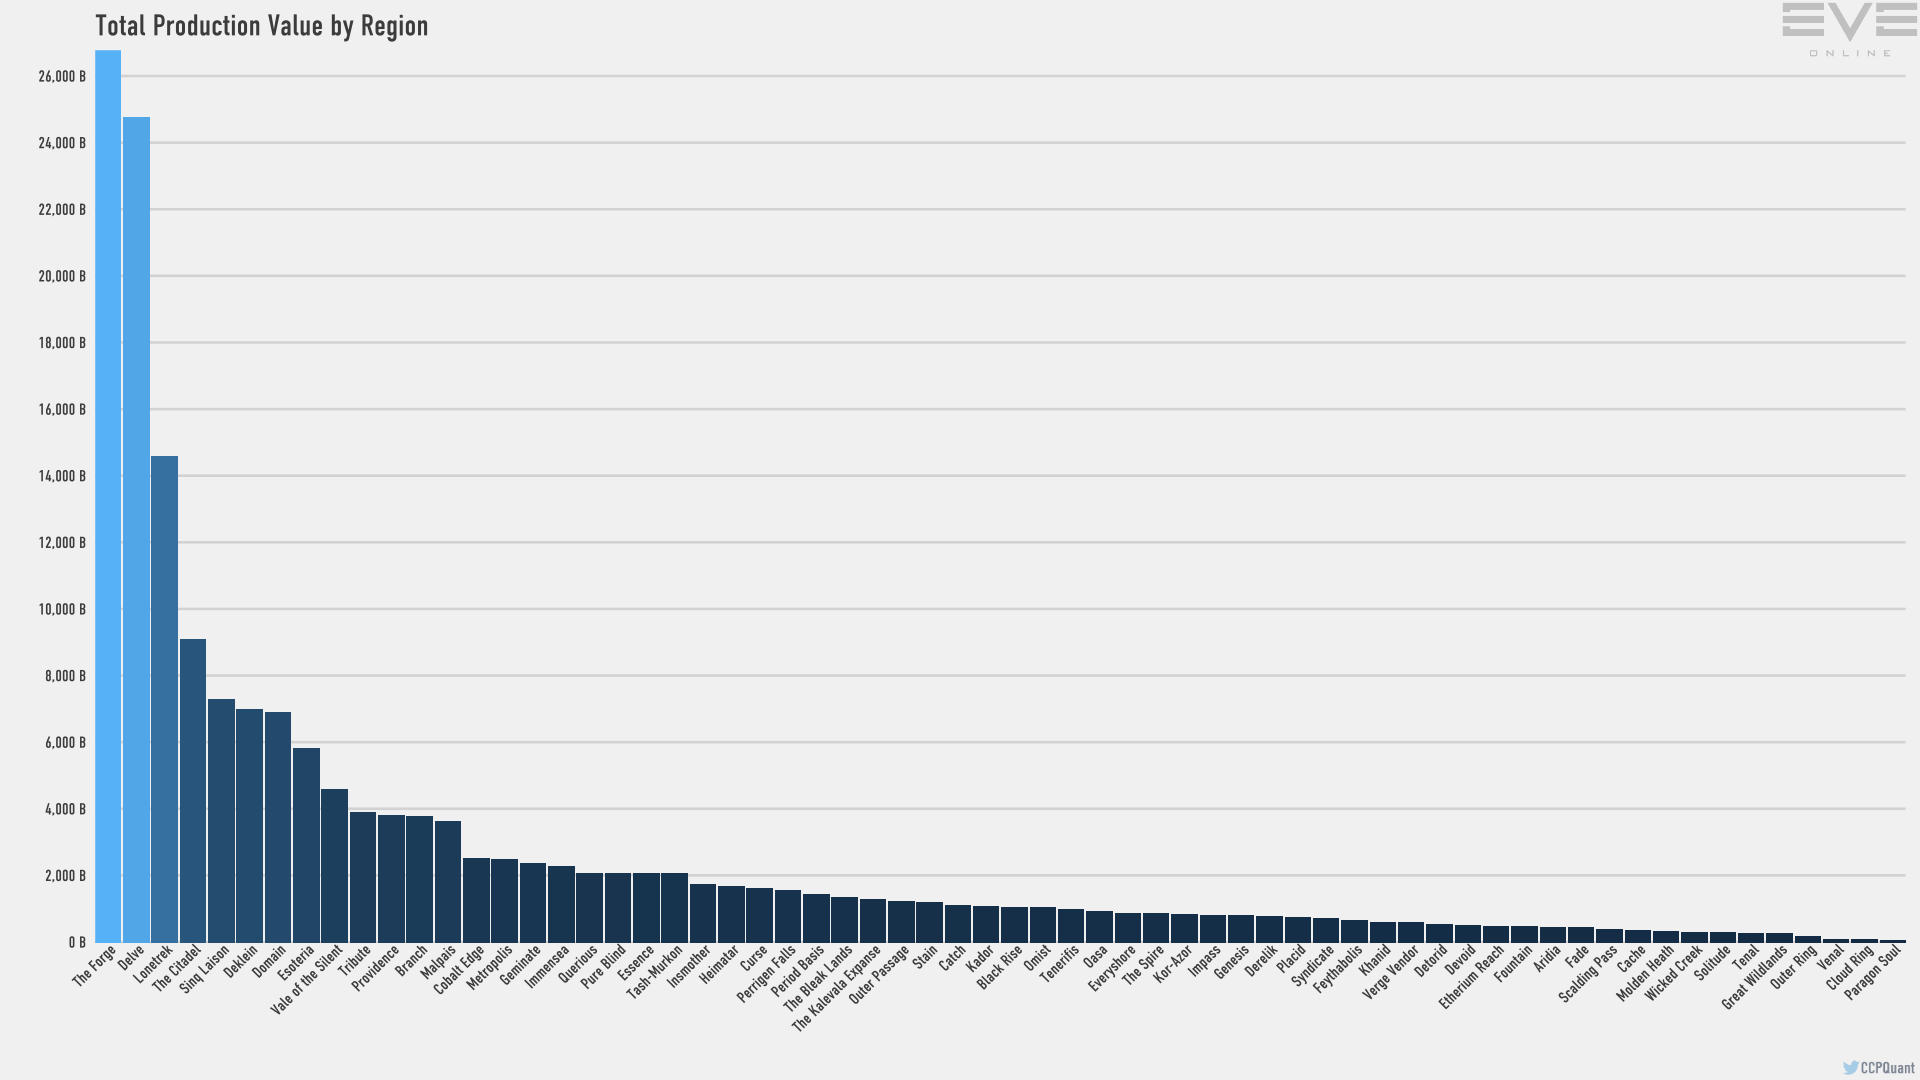
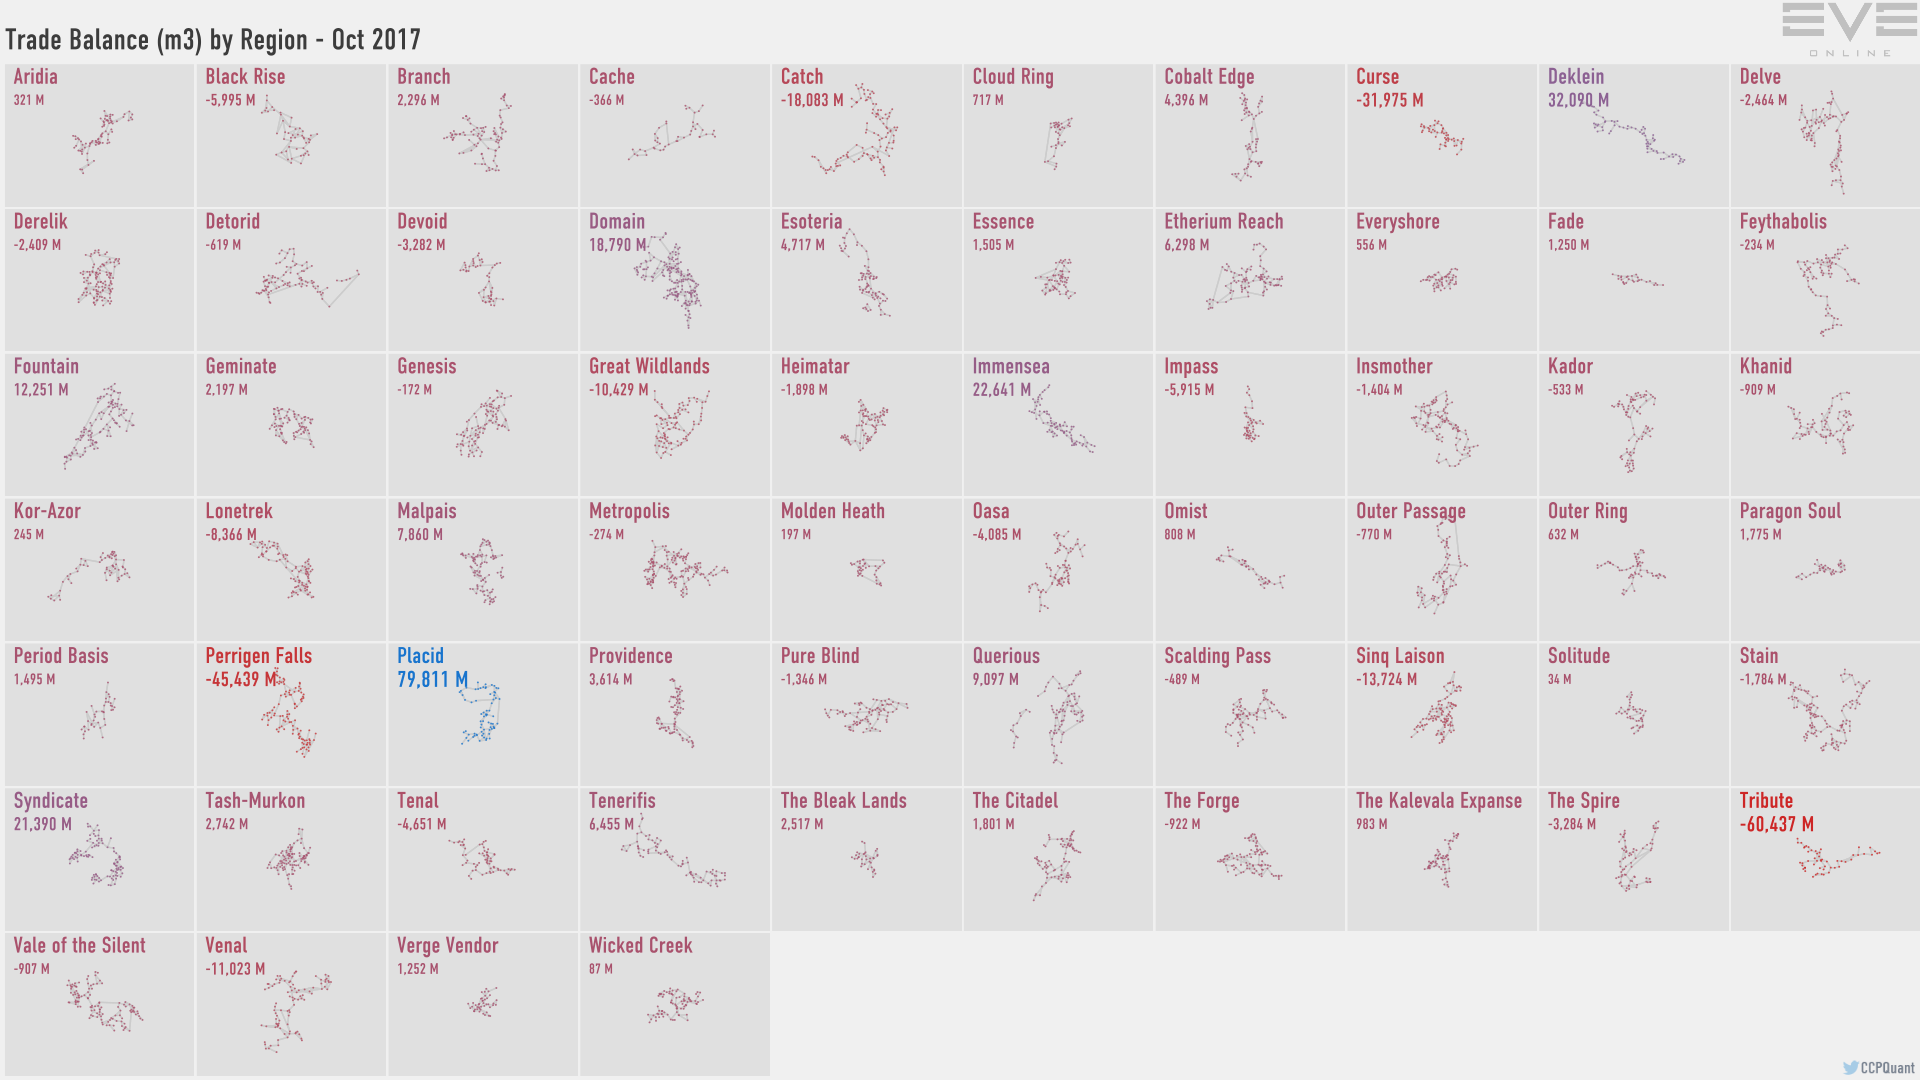
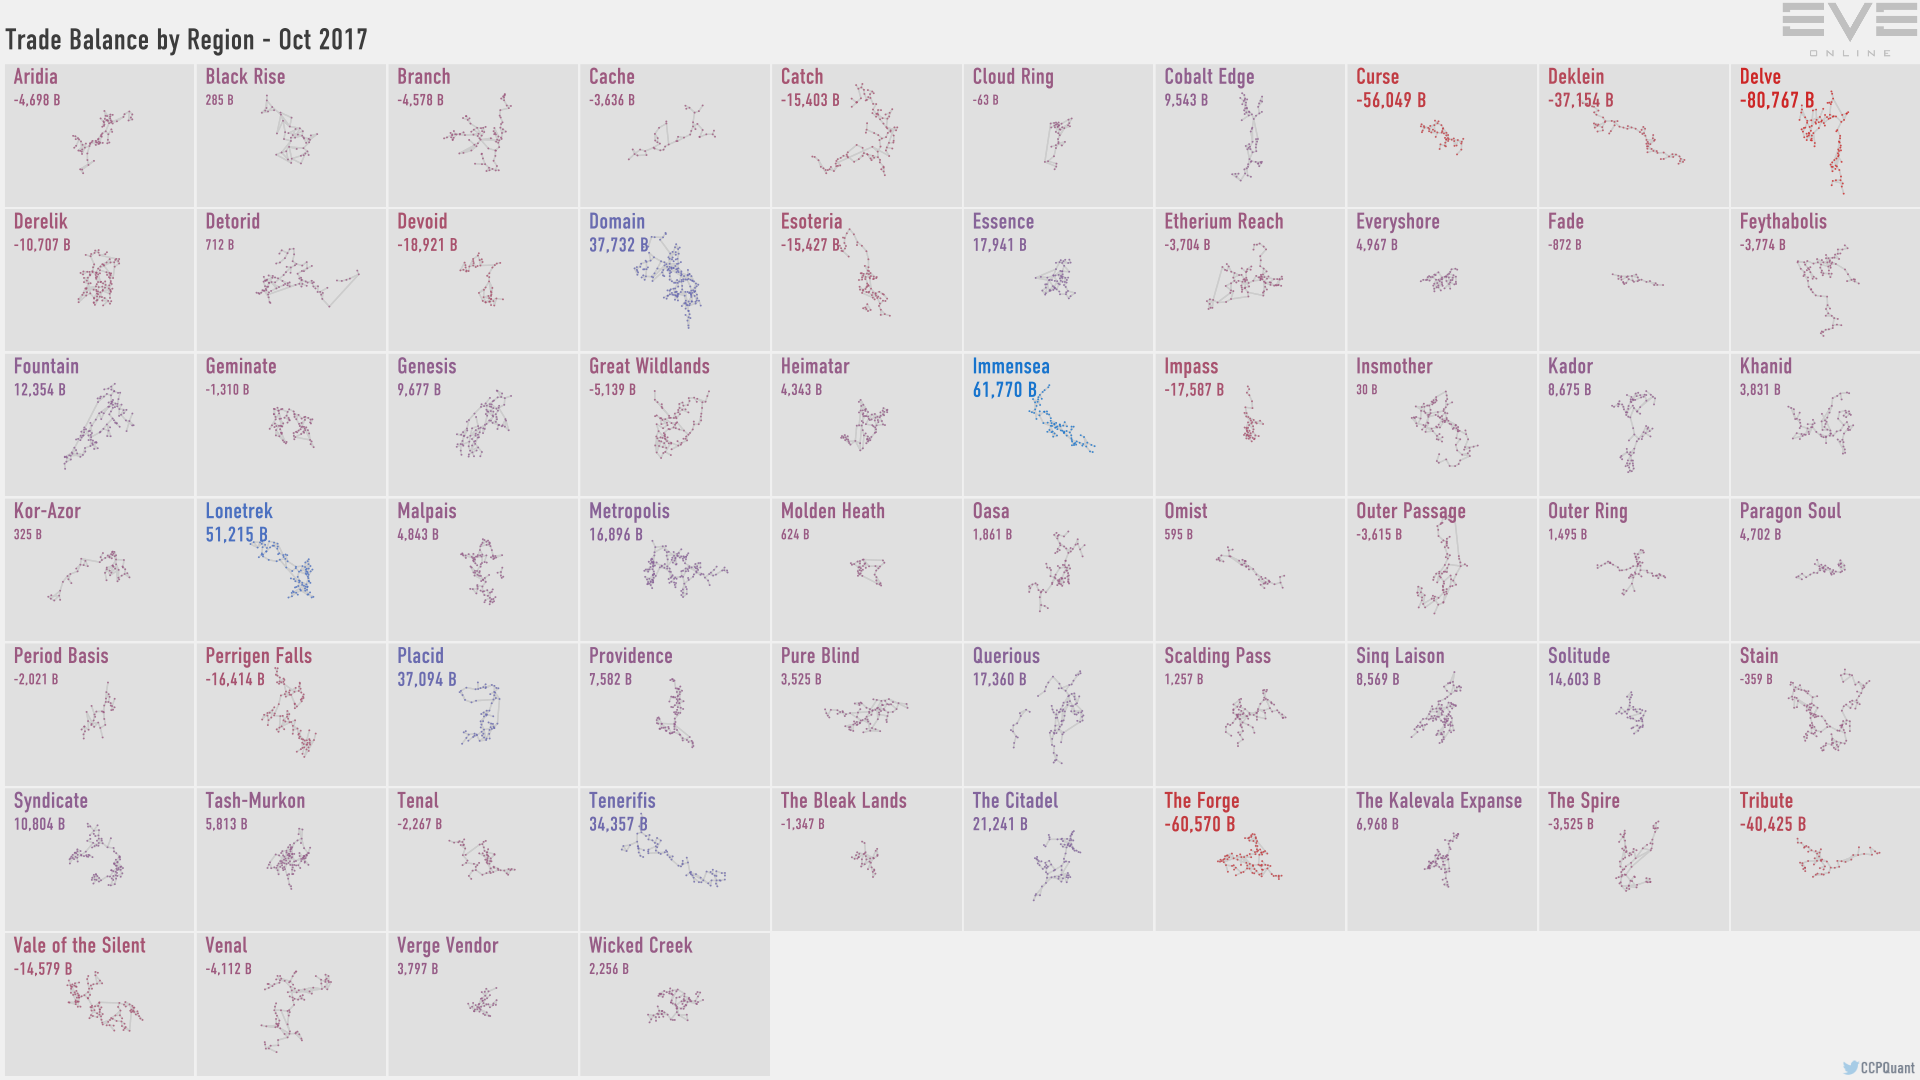
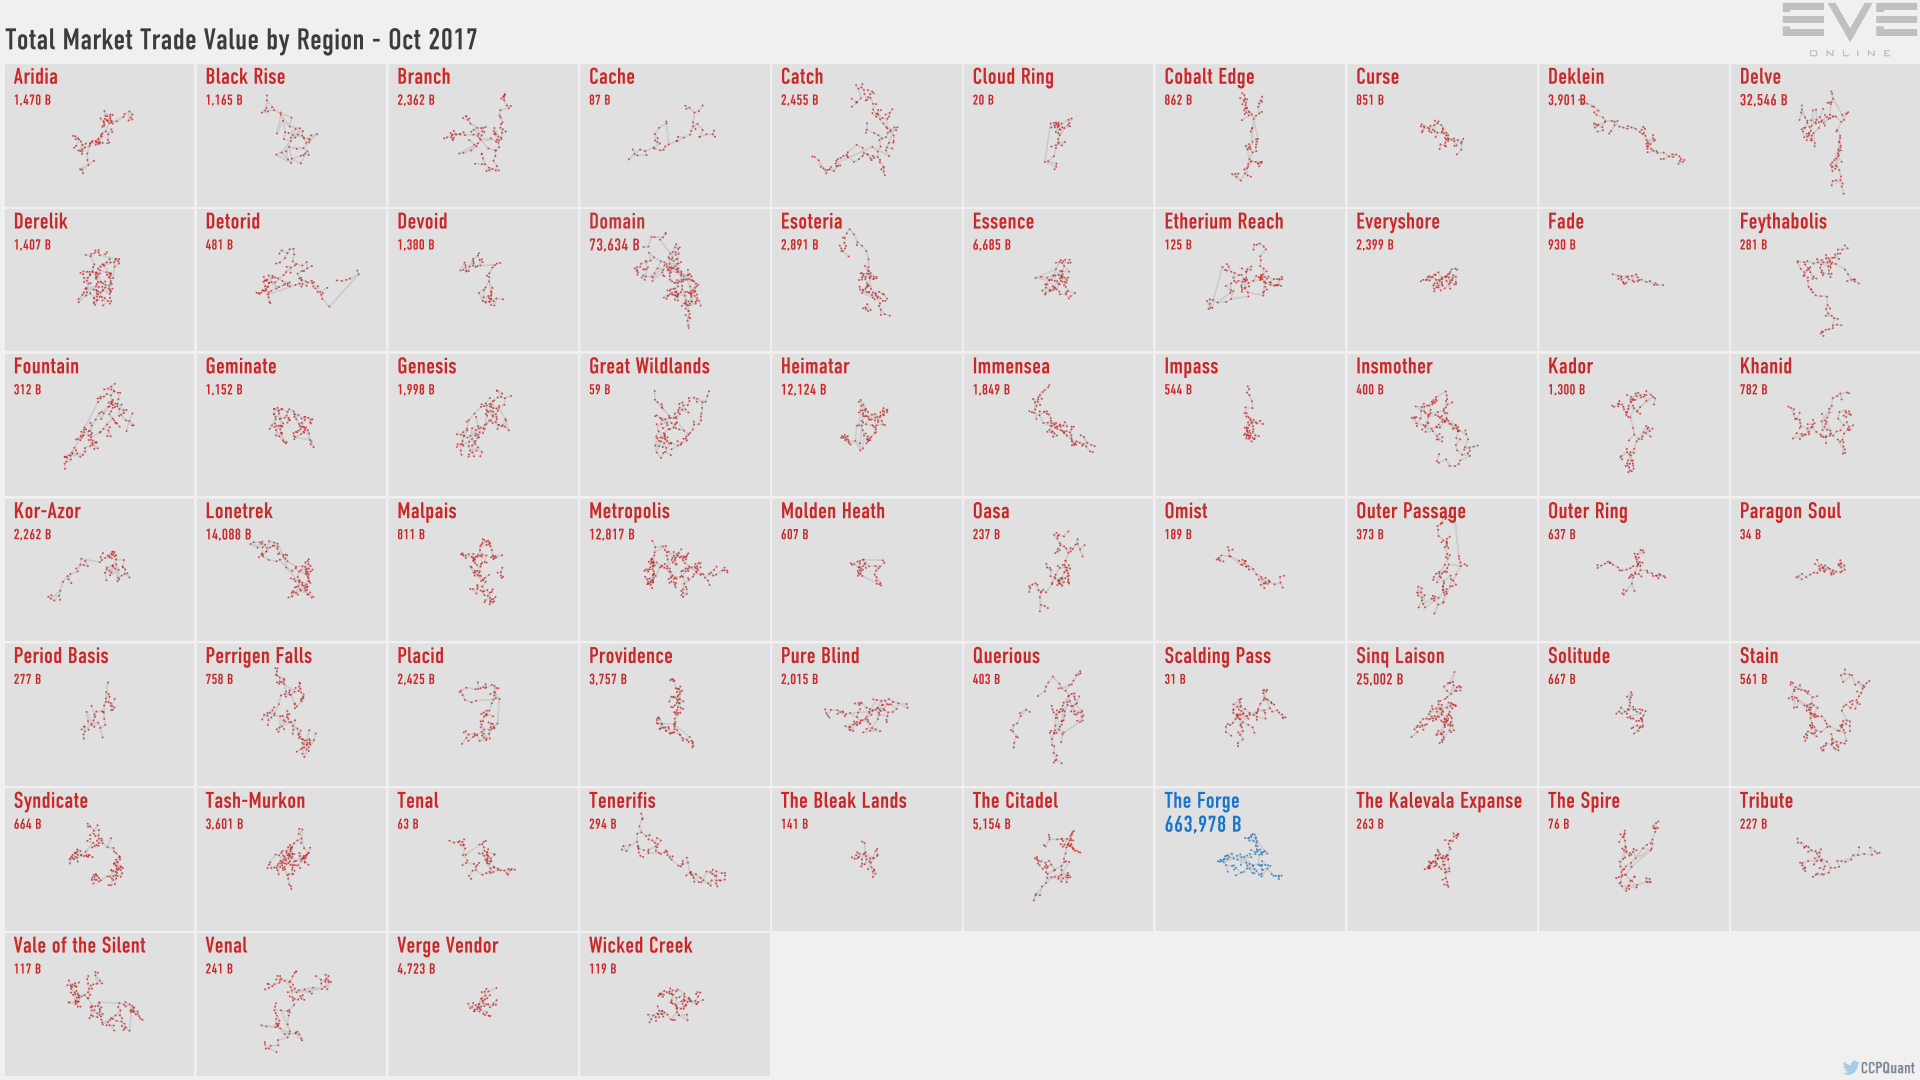
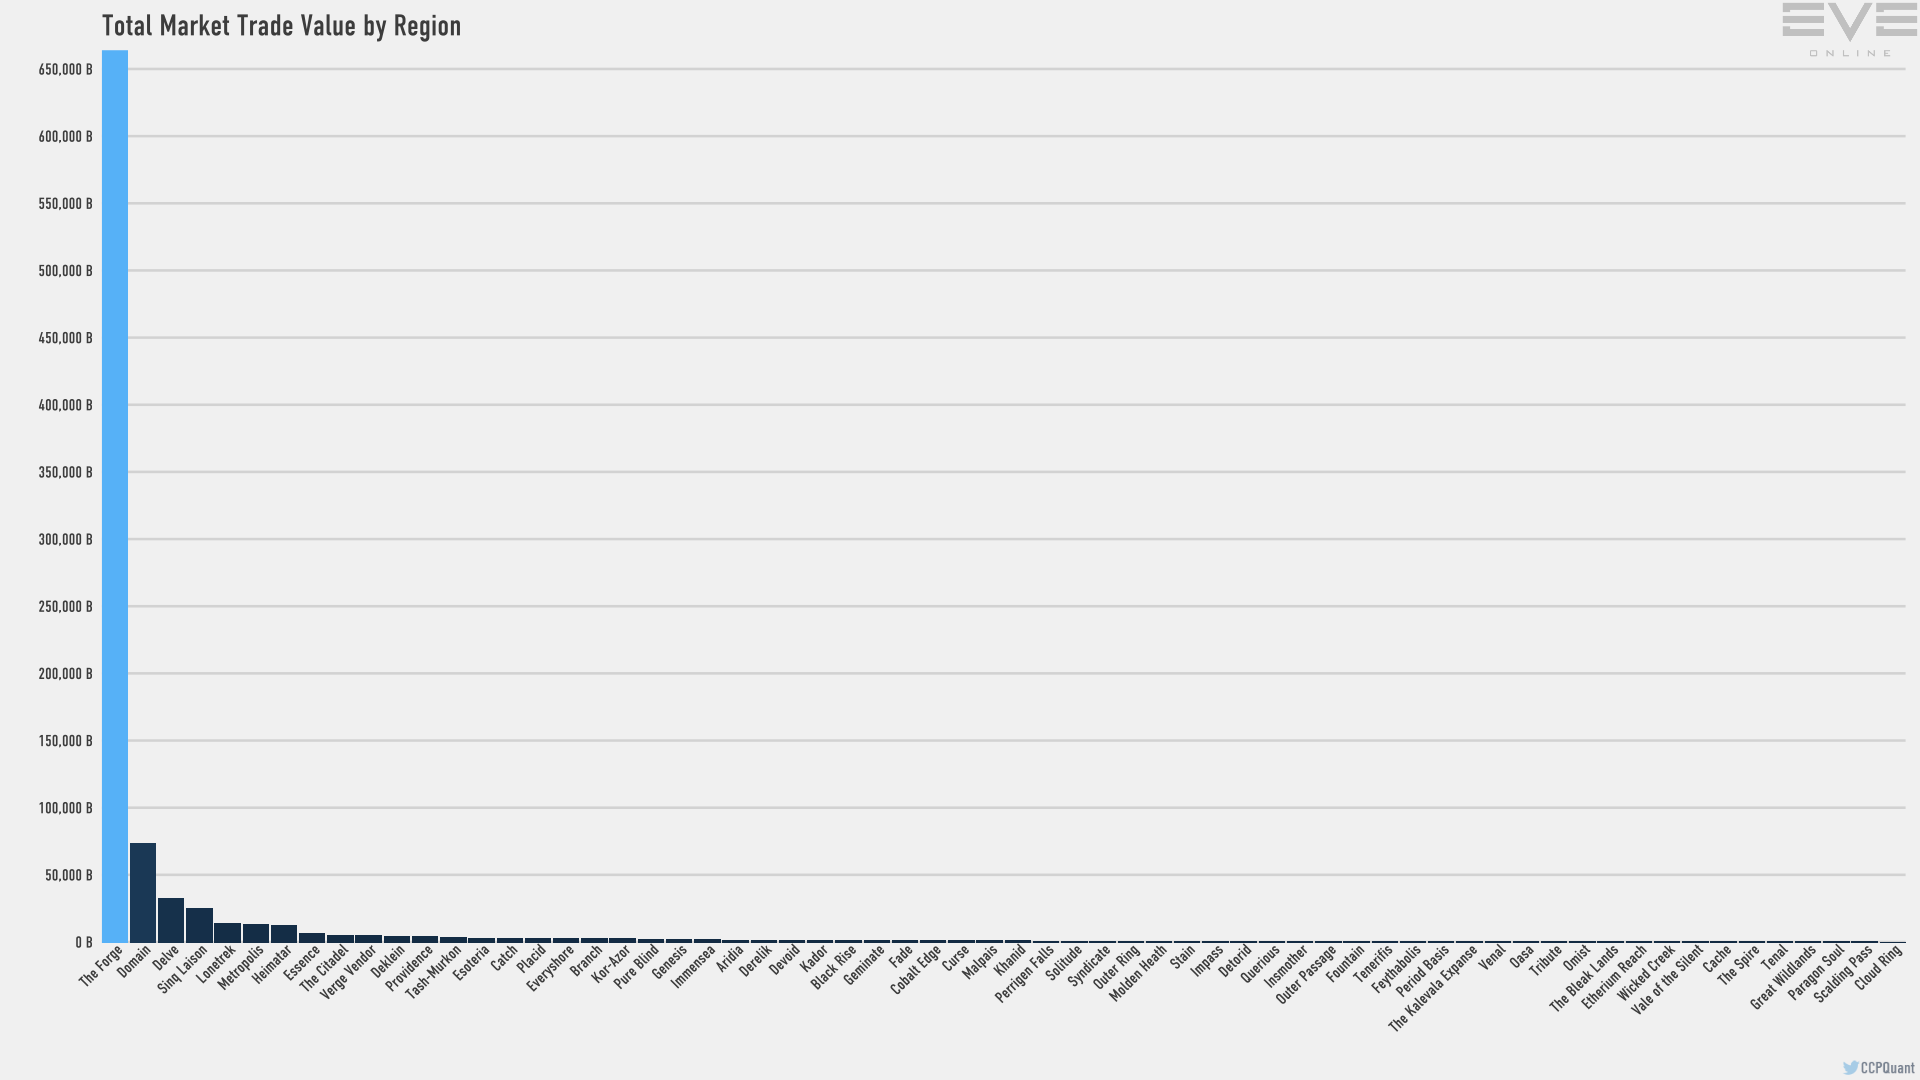
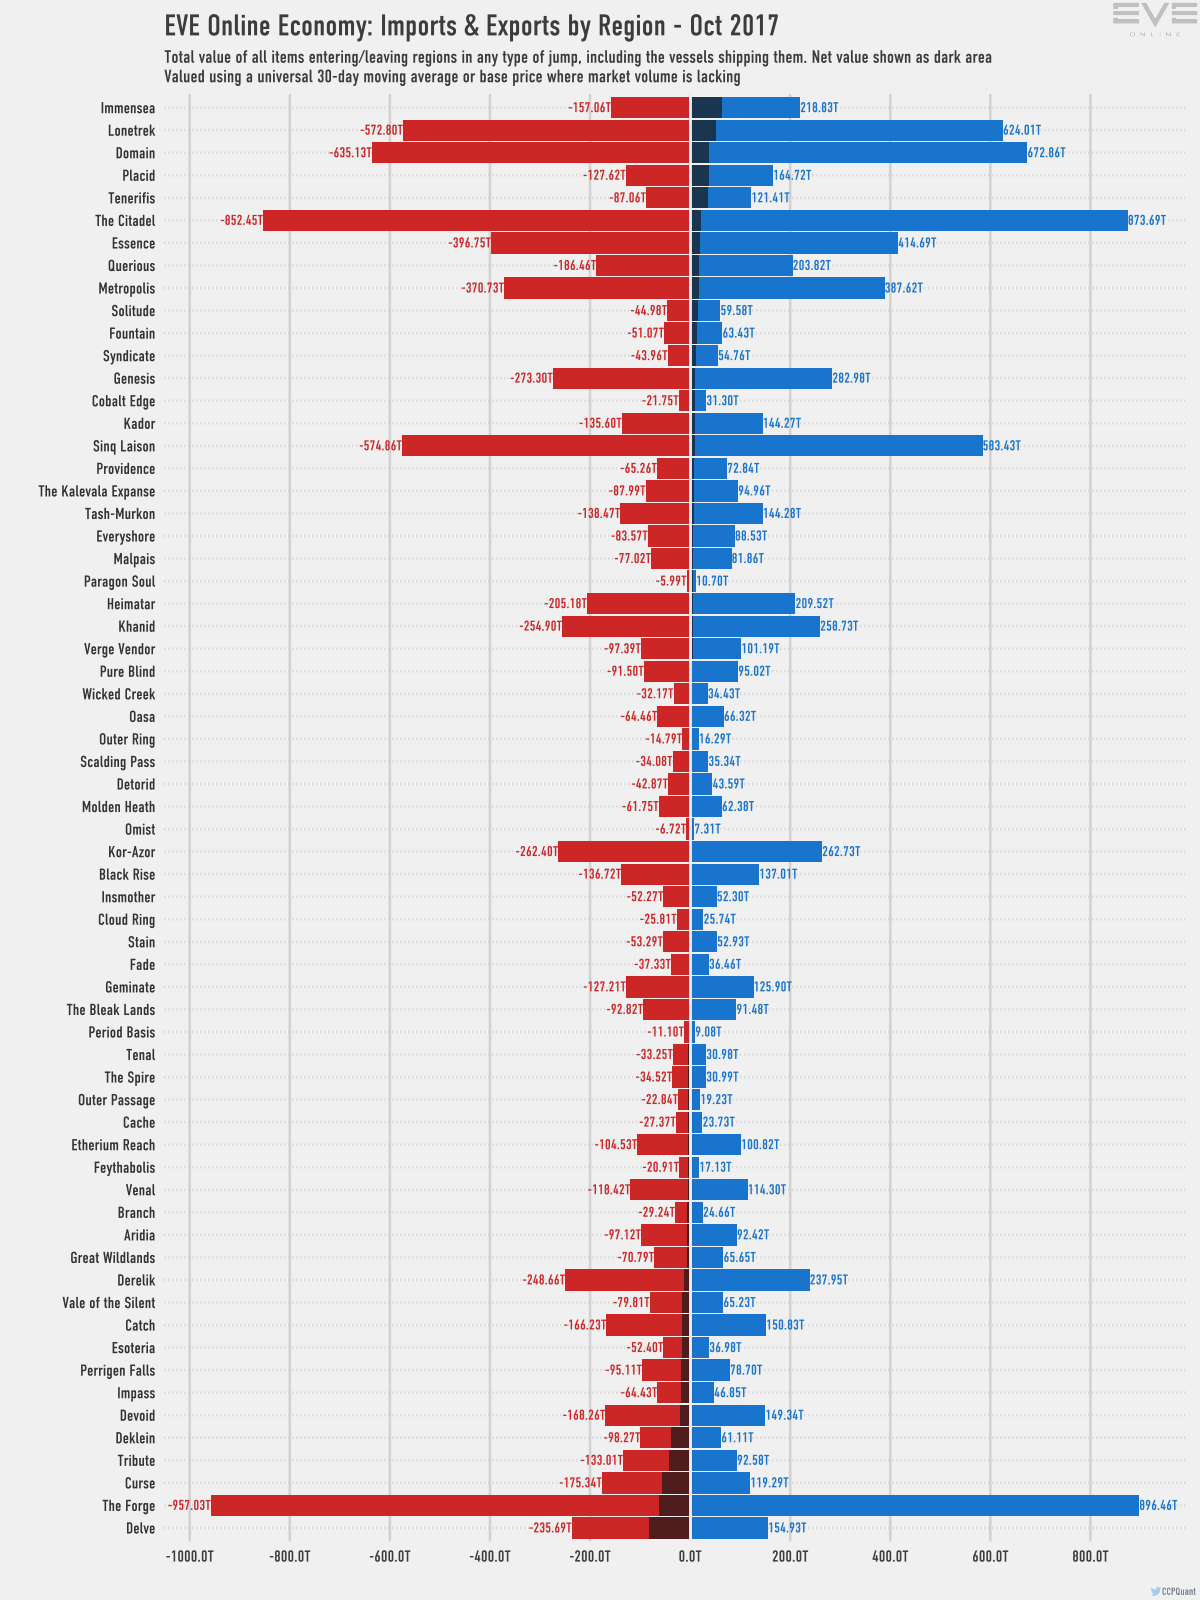
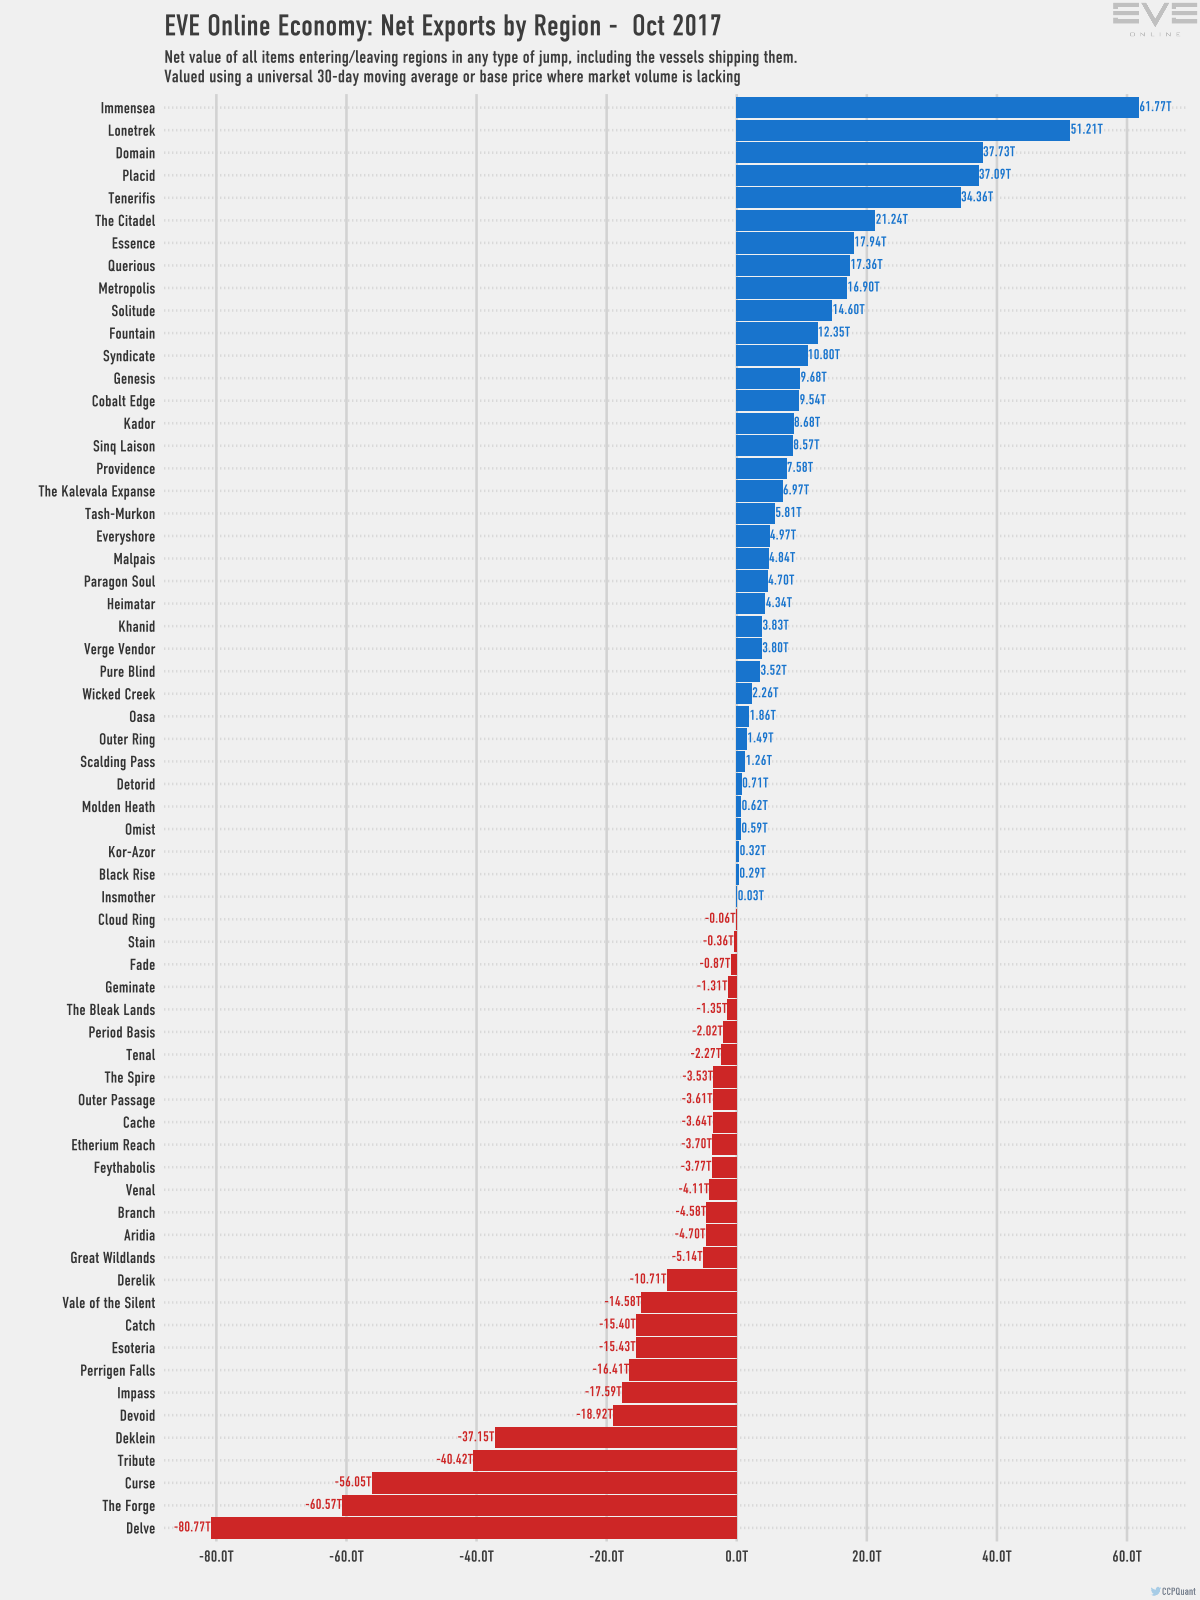
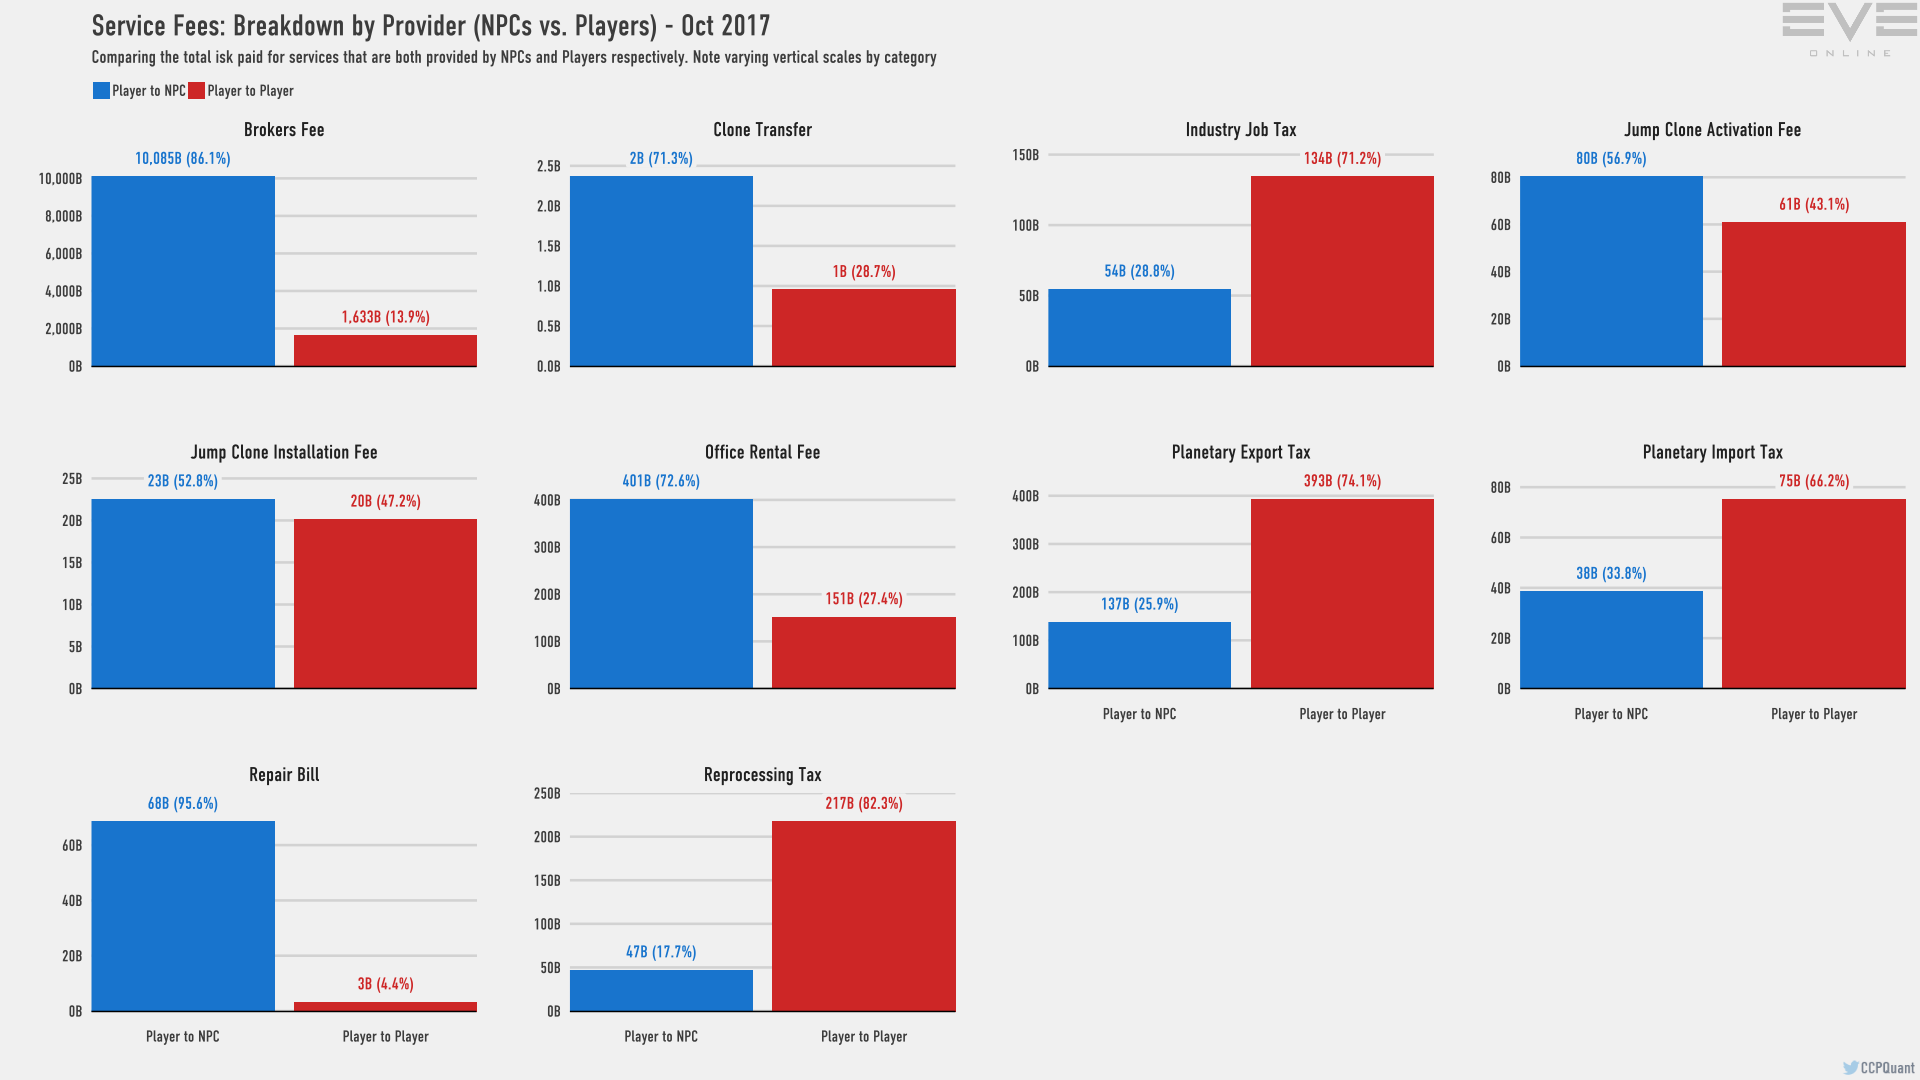
Some of you may think those region graphs are pretty much useless graphical representations that could easily be replaced by simple bar charts. I absolutely agree with that, they were initially made as presentation material for EVE Vegas and not really suitable here, but now by popular demand, as you can see above, bar chart versions have been added to each of the regional graphs.
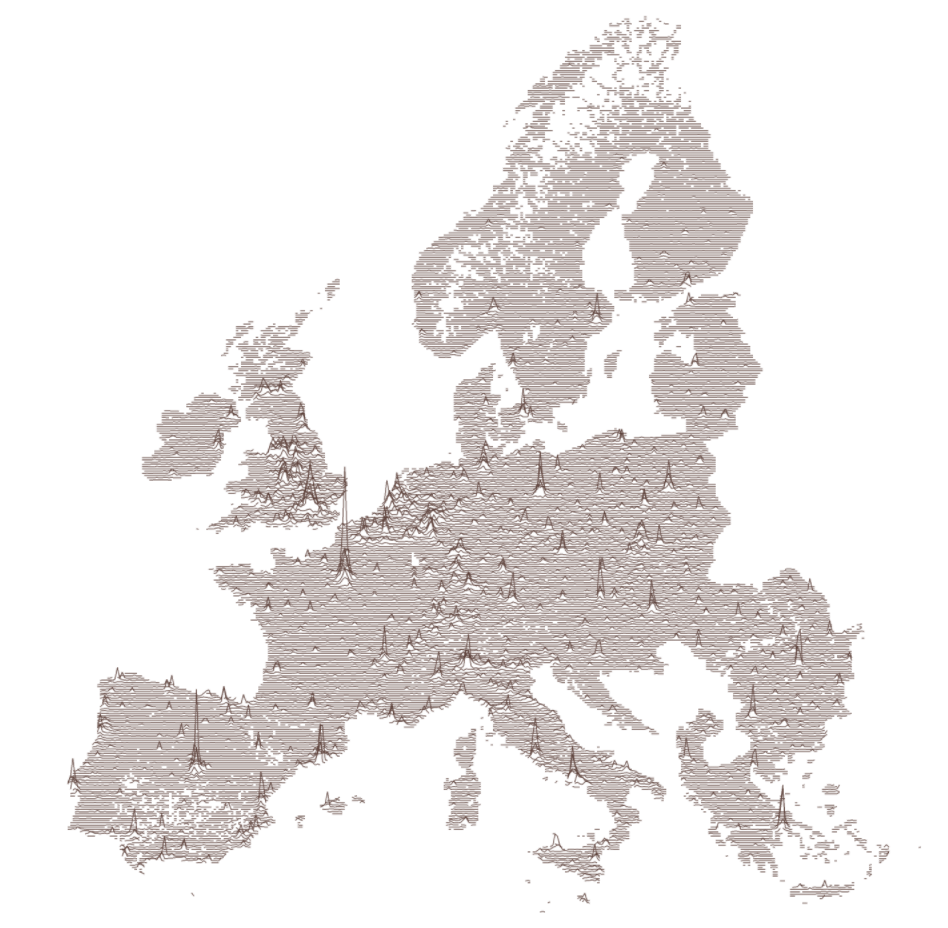
I've also been looking for interesting ways to visualize regional data, and came upon this reddit post one evening, that had this graph showing the population in Europe, bar Iceland of course (there's even a subreddit for this):
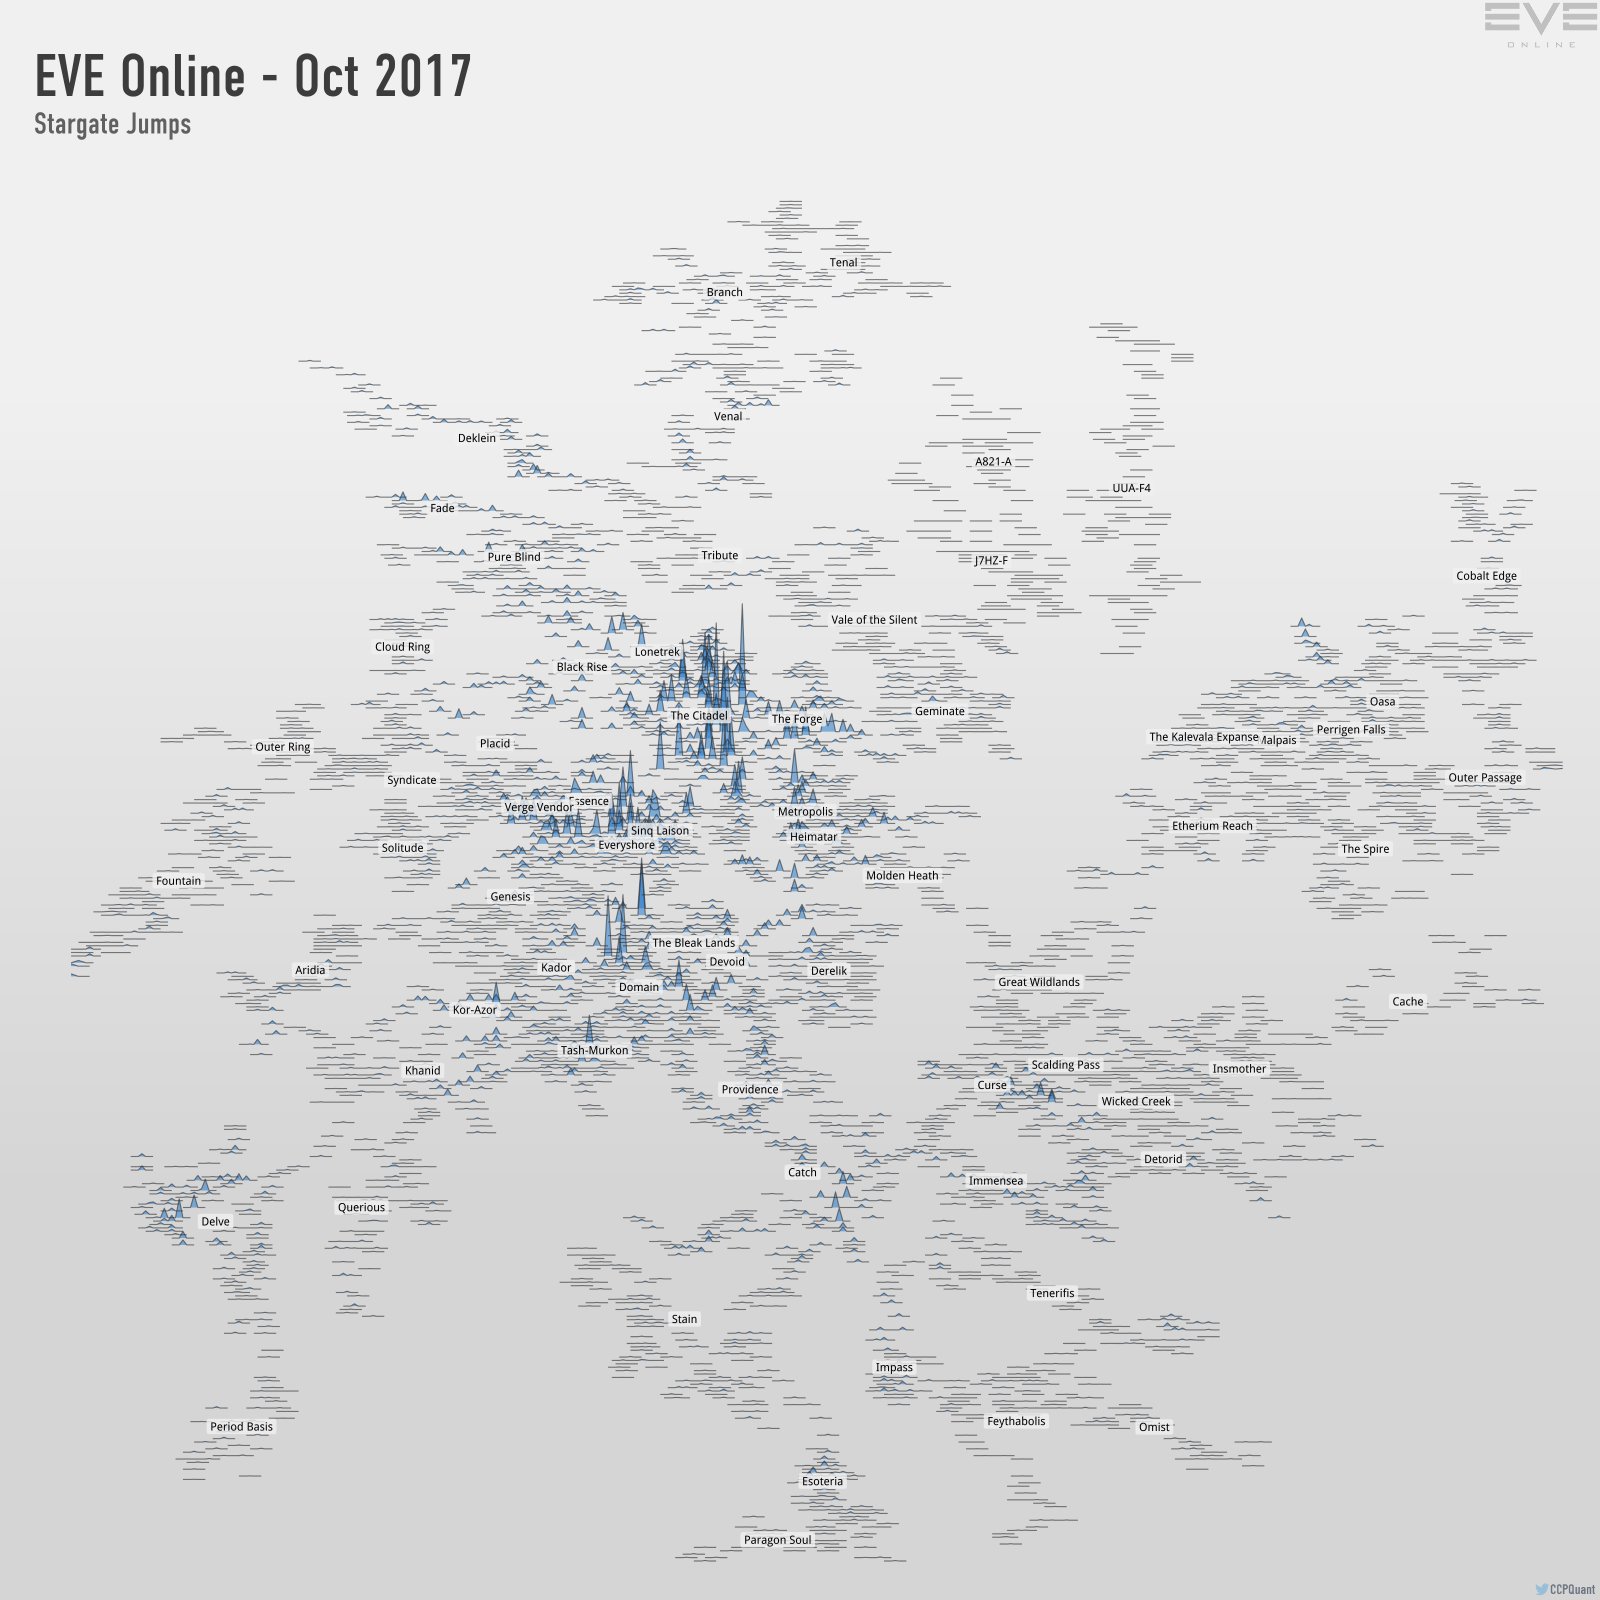
I thought this was a really interesting way to visualize data on a 2D map and wanted to see if I could apply this to the EVE Starmap. The first issue I had was that I couldn't, because to make a map like this you need a lot of datapoints (lat/long) to make the maps to begin with, then use the lat/long of cities to raise the lines relative to some number like population. I solved this issue by smearing out the starmap with a centered moving average filter, with some interesting results:
.png)
